

Abstract
Abstract 4946
Establishing the diagnosis of Myelodysplastic Syndromes (MDS) is a challenging task for hematologists due to the heterogeneity of this clinical entity. Several attempts have been made to include findings from advanced technologies to the diagnostic criteria of MDS, but still in the majority of cases, morphology of peripheral blood and bone marrow remains the cornerstone for the diagnosis. Flow cytometry(FC) can identify abnormal antigen expression on myeloid cells. FC has been proposed as a complementary method in the diagnosis of low and intermediate risk MDS, particularly for patients not exhibiting characteristic karyotype abnormalities. On the other hand, recent literature suggests that these findings are not MDS-related, questioning the specificity of immunophenotyping for the diagnosis of MDS.
The aim of the present study is to maximize the utility of FC data and simplify their interpretation for the diagnosis of MDS, by developing new analytical approaches of digital data, other than the conventional sequential biparametric analysis. The applied methodology was based on a mathematical model of scale analysis.
Bone marrow(BM) samples from 50 subjects were analysed for the expression of CD45PC7, CD11bPC5, CD16FITC and CD13PE (antigens by Beckman Coulter, FC500 flow cytometer Beckman Coulter). 36 patients were diagnosed with MDS (23 low risk, 13 high risk) and 14 patients had other than an MDS diagnosis (ITP, chronic idiopathic neutropenia, systemic lupus erythematosus, LGL leukemia, age-related cytopenias, aplastic anemia, myelofibrosis etc). Additionally, 3 BM samples of patients with post-MDS acute myeloid leukemia(AML) were analysed.
The data used for the development of the mathematical model were the following: two populations (neutro1, neutron2) were gated according to their CD45 and CD13/CD16 antigen expression (Figure 1i-1v).
Seven subpopulations of Neutrophils were defined on CD11b/CD16 density plot N=g+h+i and O=k+j (Figure 1vi).
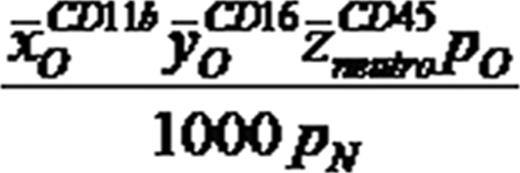
The HeSK ratio combines fluorescence levels of CD16, CD11b and CD45 with the percentage of two distinct neutrophil populations (N and O), which differ in their maturation and differentiation stage. The ratio can quantify the abnormal differentiation profile of mature myeloid cells and thus distinguish MDS from non-MDS samples with statistical significance P<0. 0001 (Kruskal Wallis test) as indicated in graph 1. Descriptive statistics are shown in table 1.
· HeSK ratio is based upon a novel FC analysis method that could change the conventional biparametric routine FC analysis and quantify patterns that are not evaluated properly. Mathematical modeling of antigen expression patterns optimizes the interpretation of single immunophenotype findings.
· The present study proposes HeSK as a complementary diagnostic tool for MDS and a strong indicator for the classification of the patients according to their prognosis as well.
*the name HeSK comes from the initials of the 4 main authors (H=Hala, e=Evgenia, S=Smirni, K=Kolliopoulou).
| non MDS | low risk MDS | high risk MDS | |
|---|---|---|---|
| Number of values | 14 | 23 | 13 |
| Minimum | 50,76 | 4,789 | 0,2850 |
| 25% Percentile | 304,8 | 26,11 | 17,05 |
| Median | 2133 | 92,52 | 47,64 |
| 75% Percentile | 10650 | 228,9 | 144,3 |
| Maximum | 55040 | 3043 | 671,7 |
| Mean | 10320 | 316,1 | 122,7 |
| Std. Deviation | 17860 | 647,9 | 185,1 |
| Std. Error | 4773 | 135,1 | 51,33 |


No relevant conflicts of interest to declare.

This feature is available to Subscribers Only
Sign In or Create an Account Close Modal