Abstract
Abstract  475
475
For sickle cell disease (SCD) patients (pts), inadequate care during pediatric to adult transition may result in increased emergency department (ED) utilization. Emergency department reliance (EDR: total ED visits/total ambulatory [outpatient + ED] visits) identifies the proportion of ED visits in relation to all ambulatory visits and differentiates between acute episodic ED users from those who may not have adequate access to outpatient care. The aim of this study is to investigate age-related patterns of EDR and associated healthcare costs in pediatric SCD pts and those transitioning from pediatric to adult care.
State Medicaid data from FL (1998–2009), NJ (1996–2009), MO (1997–2010), IA (1998–2010), and KS (2001–2009) were used for this study. Pts with ≥2 SCD diagnoses (ICD-9 282.6x) and ≥1 blood transfusion were included in the analysis. Pts were followed for as long as they were enrolled in Medicaid. Quarterly rates of outpatient visits, ED visits, EDR, SCD complications associated with ED visits, and ED visits resulting in hospitalization were evaluated. Total healthcare costs were calculated and stratified by outpatient (OP), inpatient (IP), ED, and prescription drug (Rx). SCD complications included pain, stroke, leg ulcers, avascular necrosis, infections, as well as pulmonary, renal, and cardiovascular events. Based on published thresholds, high EDR was defined as >0.33. A logistic regression model was used to assess associations between high EDR and transition age (<18 vs. ≥18 years [yrs]), transfusions, hydroxyurea use, and SCD complications. Other covariates included transfusions during the previous quarter, other relevant medications (e.g.: pain medication, diuretics, anticoagulants), comorbidities (e.g.: hypertension, myocardial infarction, liver disease), and, serving as proxies for overall health status, the frequency of OP, IP, and ED visits during the previous quarter. Regressions analyses were also used to calculate adjusted costs differences between pts with high vs. low EDR.
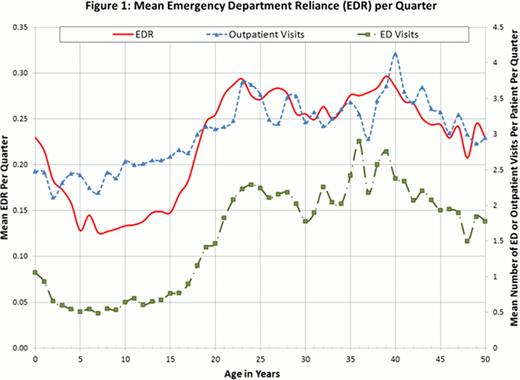
A total of 3,208 pts were included (FL: 1,550, NJ: 992, MO: 489, KS: 121, IA: 56) in the study. Each pt was observed for an average (SD) of 6.0 (3.1) yrs. Average ED visits/quarter increased from 0.76 to 2.29 between age 15 and 24, reaching a peak of 2.9 at age 36 (Figure 1). Regardless of age, the most common SCD complications associated with ED visits were pain, infection, and pneumonia. Beginning at age 15, EDR rose from 0.17 to reach 0.29 at age 22, and remained high throughout adulthood. The quarterly rate of ED visits resulting in hospitalizations followed a similar pattern. Regression analysis indicated that pts were more likely to have high EDR during the post-transition period (≥18 yrs old, odds ratio [OR]: 2.38, p<0.001) and when experiencing an SCD complication (OR: 4.18, p<0.001). Pts with high EDR incurred statistically significantly higher inpatient and ED costs, resulting in significantly higher total costs (high vs. low EDR, unadjusted costs difference, OP: -$441, p<.001; IP: $7,427, p<.001; ED: $442, p<.001; Rx: -$447, p=0.182; total: $7,376, p<.001 [Table 1]; adjusted costs difference, OP: -$285; IP: $3,485; ED: $120; Rx: -$91; total: $3,086, p<.001 for all).
Compared to children, pts transitioning to adulthood relied more on ED for their care. Moreover, pts with high EDR incurred more frequent hospitalizations and significantly higher healthcare costs, highlighting the need to improve transition related support including better access to primary care and increased engagement with SCD patients.
Mean Quarterly Healthcare Costs in Patients with High vs. Low EDR
| . | Low EDR (≤ 0.33) [A] . | High EDR (> 0.33) [B] . | Cost Difference [B] - [A] . | P-value . |
|---|---|---|---|---|
| Total Costs ($) | 7,339 | 14,715 | 7,376 | <.001 |
| Before 18 yrs old | 5,983 | 9,615 | 3,633 | <.001 |
| After 18 yrs old | 9,118 | 17,238 | 8,121 | <.001 |
| OP Services ($) | 1,222 | 781 | −441 | <.001 |
| Before 18 yrs old | 1,207 | 510 | −697 | <.001 |
| After 18 yrs old | 1,243 | 915 | −328 | <.001 |
| IP Services ($) | 3,543 | 10,971 | 7,427 | <.001 |
| Before 18 yrs old | 2,554 | 7,352 | 4,798 | <.001 |
| After 18 yrs old | 4,841 | 12,762 | 7,920 | <.001 |
| ED Costs ($) | 57 | 499 | 442 | <.001 |
| Before 18 yrs old | 35 | 191 | 157 | <.001 |
| After 18 yrs old | 85 | 651 | 566 | <.001 |
| Rx costs ($) | 1,262 | 816 | −447 | 0.182 |
| Before 18 yrs old | 981 | 330 | −651 | <.001 |
| After 18 yrs old | 1,632 | 1,056 | −576 | <.001 |
Blinder:Novartis Pharmaceuticals: Consultancy, Research Funding. Vekeman:Novartis Pharmaceuticals: Research Funding. Sasane:Novartis Pharmaceuticals: Employment. Trahey:Novartis Pharmaceuticals: Research Funding. Paley:Novartis Pharmaceuticals: Employment. Magestro:Novartis Pharmaceuticals: Employment. Duh:Novartis Pharmaceuticals: Research Funding.
Author notes
Asterisk with author names denotes non-ASH members.

This icon denotes a clinically relevant abstract


This feature is available to Subscribers Only
Sign In or Create an Account Close Modal