Abstract
Abstract 4264
Recent reports have suggested an increase in the incidence of T-cell lymphoma (TCL) in the United States. Despite newer therapies, however, it remains unclear whether outcomes for such patients are improving over time, and whether race impacts outcome.
We analyzed the Surveillance and Epidemiology End Result (SEER) Database of 18 registries (SEER-18), acquiring data on all available subtypes of TCL between1992 and 2009, based upon corresponding International Classification of Diseases for Oncology (ICD-O) codes. This data was analyzed based upon histologic subtype, patient race (white vs. black vs. all others combined), year of diagnosis, and overall survival (OS; at 12, 36, and 60 months). Survival of studied patients was derived by the Kaplan-Meier method, and compared to that of the general population using the Ederer II method.
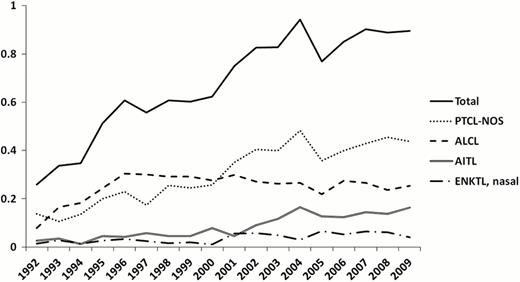
A total of 11,492 cases of TCL were included. The four most commonly occurring subtypes of peripheral TCL (PTCL) were PTCL not otherwise specified (PTCL-NOS; n=3591, 31% of all TCL), anaplastic large-cell lymphoma (ALCL; n=2762, 24%), angioimmunoblastic T-cell lymphoma (AITL; n=1077, 9%), and extranodal NK/T-cell lymphoma (ENKTL; n=526, 5%), nasal type. With the exception of ALCL, each of these is increasing in incidence, and the combined rate has more than tripled since 1992 (from 0.25 to 0.90 per 100,000 age-adjusted population from 1992 to 2009; Figure 1). Combined survival rates for all PTCL at 12, 36, and 60 months, however, are each suggestive of deterioration in outcome over time (eg, 12-month OS decreased from 80.8% in 1992 [95% CI 72.6–86.8%], to 69.1% in 2009 [95% CI 62.9–72.4%]; see Figure 2). OS rates for patients with PTCL were significantly different from those with cutaneous T-cell lymphoma (12-year rate: 58% vs. 91% p < 0.0001) and from patients with primary cutaneous CD30+ T-cell lymphoma (12-year rate: 58% vs. 93.5%, p < 0.0001). OS rates for ALCL patients were significant different from patients with primary cutaneous CD30+ T-cell lymphoma (12-year rate: 68% vs. 93.5%, p = 0.02). We subsequently analyzed the impact of race on survival for each histologic subtype. OS for PTCL-NOS among whites appeared superior to that among blacks and among other races, at 12, 36, and 60 months (eg, 12 month OS was 59% in whites, 54% in blacks and 49% in other races, but this difference was not significant. OS for ALCL was significantly worse blacks as compared to other races (p value, 0.04). For other histologies (AITL and ENKTL, nasal type), there was no significant difference in survival rates by race, though there are trends toward inferior outcomes for blacks. Alk status, known to be of prognostic significance in ALCL, is not available through the SEER database.
Despite increased incidence of PTCL throughout the last two decades, there is no suggestion of improvement in outcome, and there are significant disparities in outcome by histologic subtype and apparent albeit insignificant trends by race. Whether this represents differences in disease biology or different treatment approaches per race and/or access to care remains to be determined. While new agents have gained regulatory approval for PTCL since 2009 it remains premature to fully evaluate their impact on the outcome of TCL patients.
Survival by race for PTCL-NOS and ALCL.
| . | Race . | White . | Black . | Other . | p value . |
|---|---|---|---|---|---|
| PTCL-NOS | Number of cases | 2120 | 466 | 265 | |
| Survival duration | 12 months | 0.589 | 0.540 | 0.494 | White vs. Black: 0.98 |
| 36 months | 0.401 | 0.341 | 0.332 | White vs. Other: 0.99 | |
| 60 months | 0.336 | 0.290 | 0.258 | Black vs. Other: 0.887 | |
| ALCL | Number of cases | 1883 | 296 | 161 | |
| Survival duration | 12 months | 0.688 | 0.600 | 0.693 | White vs. Black: 0.99 |
| 36 months | 0.561 | 0.482 | 0.580 | White vs. Other: 0.59 | |
| 60 months | 0.519 | 0.455 | 0.520 | Black vs. Other: 0.04 |
Petrich:Seattle Genetics: Research Funding, Speakers Bureau; Allos Therapeutics: Consultancy, Speakers Bureau; Genentech: Consultancy, Speakers Bureau.
Author notes
Asterisk with author names denotes non-ASH members.


This feature is available to Subscribers Only
Sign In or Create an Account Close Modal