Abstract
Abstract 3795
Both basal and cytokine-induced phosho-STAT3 and pSTAT5 levels are altered in leukemias and profiling the STAT signaling network at the single cell level provides prognostic information (Irish et al, 2004). As cell signaling interacts with the epigenome (Mohammad et al, 2010) and numerous genes involved in signaling are aberrantly methylated in MDS (Figueroa et al, 2010) we investigated the alterations of STAT3/5 signaling in MDS progenitors during azacitidine therapy.
Bone marrow samples of 58 high-risk MDS and AML/MDS patients were obtained before (d0) and 15 days (d15) after azacytidine initiation and at the indicated time points. According to the IWG response criteria, patients were divided into 4 groups: response (CR and PR, n=11 and n=5, respectively), hematologic improvement (HI, n=8), stable disease (SD, n=11) and failure (F, n=23). Mononuclear cells were either left untreated or stimulated with G-CSF and GM-CSF for 15′ and then stained intracellularly with the indicated antibodies. The hematopoietic hierarchy and G-CSF receptor (CFS3R) transcripts by qPCR were assessed on immunomagnetically purified Lin-CD34+ and CD34+ cells, respectively. Statistical comparisons were done by ANOVA and unpaired or paired t-tests as appropriate. STAT signaling profiles (SPs) in CD34+ cells were grouped using complete linkage hierarchical clustering and correlated with treatment response, karyotype and transfusion rate by using χ2 or Fisher Exact tests.
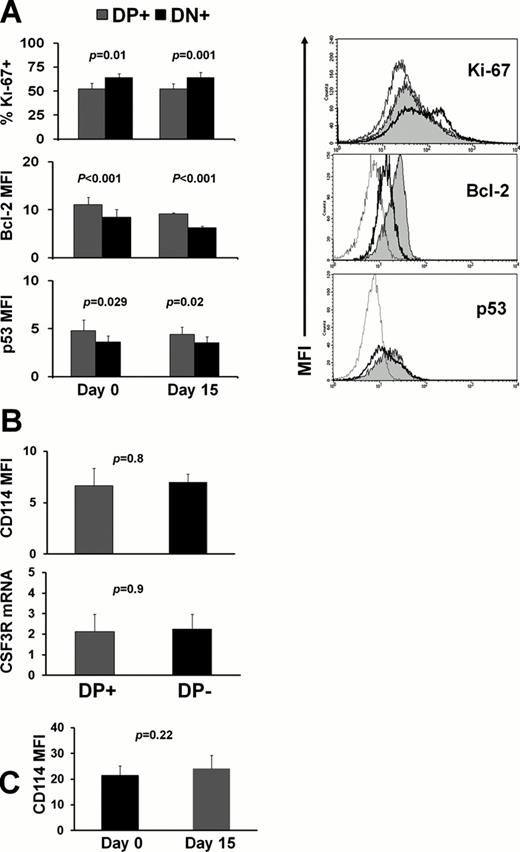
Unsupervised clustering of pretreatment SPs in CD34+ cells identified 2 clusters (Fig 1A) mainly differing in the degree of potentiated STAT3/5 phosphorylation. Patients in cluster I displayed weak potentiated expression of pSTAT3/5 and had marginally better response to azacytidine compared to the ones in cluster II (p=0.06), whereas there were no differences among the two groups regarding the MDS subtype (p=0.41), karyotype (p=0.45) and transfusion rate (p=0.33). We further identified a G-CSF-inducible pSTAT3/5 double positive (DP) subpopulation of MDS CD34+ cells, whose levels both at d0 and d15 of the 1st cycle were inversely associated with response (Fig 1B), whereas its kinetics were following the disease course and response to azacytidine (Fig 1C,D). The DP subset was enriched in GMPs compared to the G-CSF-unresponsive pSTAT3/5 double negative (DN) subpopulation, suggesting a higher leukemia initiating cell activity (Goardon et al, 2011), whereas the DN subset was marginally enriched in MEPs (Fig 2). Also, compared to the DN subset, the DP population exhibited decreased Ki67 expression and increased Bcl2 and p53 levels (Fig 3A), indicating quiescence and increased antiapoptotic and tumor suppressive properties, respectively. Of note, the levels of the above molecules in the two subsets remained unaltered both at d0 and d15, indicating that these subsets represent genuine cellular entities with solid properties. To determine if CSF3R expression and/or its modulation by azacitidine are responsible for the alterations of the DP population, we checked CSF3R levels in isolated CD34+ cells from patients with either absence or full expression of the DP subset because CSF3R is downregulated after G-CSF stimulation. The two groups showed identical protein and mRNA levels of CSF3R at both d0 and d15 (Fig 3B,C).
In summary, we identified a G-CSF-inducible pSTAT3/5 DP subpopulation with leukemic stem cell properties, which is potentially involved in MDS biology and epigenetically modulated, as implied by its kinetics during hypomethylating therapy. More important, given the strong association of pretreatment levels of the DP subset with the response to azacitidine, the latter subset may serve both as a treatment target and response biomarker.
(A) Heatmap of pretreatment SPs in CD34+ cells. (B) The DP subset was significantly decreased in responding patients. (C, D) Results and representative plots of the DP subset kinetics in patients with R (n=7), HI (n=3), SD (n=1) and F (n=3).
(A) Heatmap of pretreatment SPs in CD34+ cells. (B) The DP subset was significantly decreased in responding patients. (C, D) Results and representative plots of the DP subset kinetics in patients with R (n=7), HI (n=3), SD (n=1) and F (n=3).
(A) Cytometric and (B) cumulative analysis (n=8) of the hematopoietic hierarchy in DP and DN subsets.
(A) Cytometric and (B) cumulative analysis (n=8) of the hematopoietic hierarchy in DP and DN subsets.
(A) Results and histograms of ki67, Bcl-2 and p53 assessment in DP (grey fill) and DN (thick line) subsets (control, thin line). (B) Protein and mRNA expression of CSF3R in patients with absence (n=5) or full expression (n=5) of the DP population. (C) Similar CSF3R levels at d0 and d15, despite changes in the levels of the DP subset (not shown, n=5).
(A) Results and histograms of ki67, Bcl-2 and p53 assessment in DP (grey fill) and DN (thick line) subsets (control, thin line). (B) Protein and mRNA expression of CSF3R in patients with absence (n=5) or full expression (n=5) of the DP population. (C) Similar CSF3R levels at d0 and d15, despite changes in the levels of the DP subset (not shown, n=5).
Kotsianidis:Genesis-Pharma: Honoraria, Research Funding.
Author notes
Asterisk with author names denotes non-ASH members.


This feature is available to Subscribers Only
Sign In or Create an Account Close Modal