Abstract
Abstract 3708
There are few prospective studies on disease characteristics, patterns of care, response, and outcomes in elderly FL patients (pts) in the US. The NLCS is a Genentech-sponsored prospective multicenter registry study that collects this information without study-specific treatment. We utilized the NLCS database to better understand the impact of age on FL outcome.
All evaluable pts with FL histology in the NLCS were included except pts with FL plus other lymphoma histology or pts who progressed before first treatment or before being assigned to watchful waiting (WW). Using Pearson Chi-Square tests, associations of age groups (≤60, 61–70, >70) with disease characteristics and overall response (ORR) were examined. Median PFS and OS by treatment regimen were estimated using Kaplan-Meier methods for each age group. Cox proportional hazards regression adjusted for baseline factors (grade, number of nodal sites, LDH, Hgb, stage, performance status (PS), bone marrow (BM) involvement, race, and treatment center type) were used to assess treatment differences in PFS and OS and the significance of age by treatment interactions.
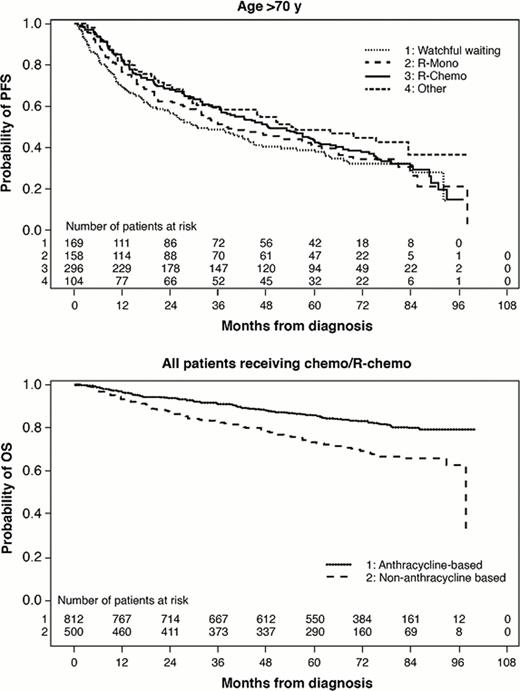
Of 2,647 pts, 47% (n=1,254) were ≤60 yrs, 25% (n=666) were 61–70 yrs, and 27% (n=727) were >70 yrs (min age of 22; max of 97). Compared with pts ≤60 yrs, pts 61–70 and >70 were more likely to be white (93% >70, 92% 61–70, and 88% ≤60, P=.02 and .02 respectively), have stage I/II disease (37% >70, 36% 61–70, and 29% ≤60, P=.0008 and .0003), have <5 nodal sites (73% >70, 69% 61–70, and 61% ≤60, P=.001 and <.0001), and have poor-risk FLIPI (53% >70, 51% 61–70, and 15% ≤60, P<.0001 and <.0001). Compared with pts ≤60, elderly pts (>70) were more likely to have FL grade 3 (24% vs 18%, P=.01). While there were no differences in geographic distribution by age, elderly pts were more likely to receive therapy at community practices (86%) versus academic institutions than pts ≤60 (77%, P<.0001) or 61–70 (81%, P=.004). Treatments varied significantly by age (P<.0001). More elderly pts were observed compared to pts ≤60 (23% vs19%). When treated, elderly pts (22%) were more likely to receive rituximab (R) monotherapy compared with patients aged 61–70 (12%) or ≤60 (10%). When chemotherapy alone or plus R was given, elderly pts were less likely to receive anthracyclines (45% vs 65% (61–70) and 68% (≤60)). Among all variables, only grade 3 histology predicted anthracycline use in all age groups. Lack of BM involvement predicted anthracycline use for younger pts (≤60 and 61–70). Of those ≤60, white pts were more likely to receive anthracyclines, and of those 61–70, those with ≥5 nodal sites were more likely to receive anthracyclines. ORRs were similar across age groups receiving similar regimens with R plus chemo providing the highest ORR. Adjusting for baseline factors, treatment (WW, R, R-Chemo, or other) benefit varied for each age group in terms of PFS (P=.02), with treatment outcomes being most differentiated among younger pts (Table). PFS appeared shorter in elderly pts regardless of the treatment received. No significant interaction between age and efficacy of anthracycline in terms of PFS or OS was observed (P-values >.65), but the overall effect of anthracycline for all pts was beneficial for PFS (HR=0.80, P=.02) and OS (HR=0.67, P=.003). Median OS was 8 years for elderly and not reached for others. After adjusting for baseline factors, no significant differences in treatment impact by age on OS were seen. Elevated LDH, reduced Hgb, stage III/IV, PS ≥1, and BM involvement were all significantly associated with shortened OS. These factors were also significantly associated with treatment choice, as worse-prognosis elderly pts were more likely to receive either R or R+chemo than WW or other treatment.
FL pts >70 yrs more commonly received R alone and less commonly received anthracyclines when treated with chemotherapy. The impact of anthracyclines on PFS did not vary by age, but differences in PFS for other treatment regimens showed a stronger association among younger pts
| PFS . | Age group . | ||
|---|---|---|---|
| . | ≤60 y . | 60–70 y . | >70 y . |
| First-line treatment . | HR (95% CI) . | HR (95% CI) . | HR (95% CI) . |
| WW vs R-Mono | 1.77 (1.29–2.43) | 1.70 (1.14–2.54) | 1.43 (1.06–1.92) |
| R-Chemo vs R-Mono | 0.55 (0.41–0.75) | 0.73 (0.50–1.06) | 0.83 (0.64–1.08) |
| Other vs R-Mono | 0.68 (0.48–0.97) | 0.88 (0.56–1.41) | 0.95 (0.66–1.37) |
| Anthracycline- vs non-anthracycline–based chemo/R-chemo | 0.82 (0.62–1.09) | 0.80 (0.55–1.16) | 0.77 (0.56–1.05) |
Nabhan:Genentech: Research Funding, Speakers Bureau. Byrtek:Genentech, Inc., a member of the Riche Group: Employment, Equity Ownership. Dawson:Genentech, Inc., a member of the Riche Group: Employment, Equity Ownership. Link:Genentech, Inc., a member of the Riche Group: Consultancy; Celgene: Consultancy; Spectrum: Consultancy. Friedberg:Genentech: Consultancy. Cerhan:Genentech: National LymphoCare Scientific Advisory Board Other. Flowers:Celgene: Consultancy; Prescription Solutions: Consultancy; Seattle Genetics: Consultancy; Millennium: Consultancy, Research Funding; Genentech: Consultancy; GIlead: Research Funding; Spectrum: Research Funding; Janssen: Research Funding; Lymphoma Research Foundation: Membership on an entity's Board of Directors or advisory committees.
Author notes
Asterisk with author names denotes non-ASH members.


This feature is available to Subscribers Only
Sign In or Create an Account Close Modal