Abstract
Abstract 3632
Although Hodgkin Lymphoma (HL) is highly curable, about 15% of patients (pts) are refractory or relapsed after first line treatment. Classic prognostic scores (e.g. IPS) are useful for identifying high risk pts, who need intensive treatment, and low risk pts, who beneficiate de-escalation to minimize side effects. However, they are not enough suitable to predict outcomes. Consequently, finding new complementary tools for detecting refractory or relapsing pts, remains a challenge. Fluorodeoxyglucose (FDG)-PET/CT involvement in initial staging has been widely studied. Although clinical or CT tumor volume is an important prognostic factor, metabolic tumor volume (MTV) is not enough explored. We performed a study to 1) determine whether MTV and maximum standardized uptake value (SUV) max could be new prognostic markers and 2) compare metabolic tissue heterogeneity with CD68 expression, a promising new prognostic factor linked with inflammatory microenvironment.
Among 456 histologically proven HL pts registered in the Regional Lymphoma database of Limousin (SRRLL, France) since 1990's, 158 have an available sample for CD68 staining. Among the 106 pts who have undergone FDG-PET, 43 pts have available quantitative initial and early response (post-C2) SUV FDG-PET/CT data. The median follow-up was 21 months (6–72.5). Pts were classified following Ann Arbor stages I: 4 pts, II: 17 pts, III: 9 pts, IV: 13 pts. FDG-PET/CT exams were performed with a biograph6 Siemens® device and analyzed with Siemens MI® application. MTV was computed for all pts with a 2D delineation technique and using a thresholding method. The threshold (T) corresponds to mean liver SUV (+3 sd) calculated into 50 cm3 of normal liver. All the tumor voxels (3D pixels) equal or greater than the T belong to MTV. MTV per pathological area (MTVa) was also analyzed. Pts with spleen lesions have an increased volume compared to the others. To minimize spleen's impact, MTV was calculated without spleen (MTVws). Quantitative FDG uptake is routinely measured by SUVmax. The mean SUVmax was also worked out into 1 cm3 around the tumor SUVmax. ROC curves were plotted for continuous variables such as age, erythrocyte sedimentation rate (ESR), MTV, SUVmax and mean SUVmax. CD68, tumor associated macrophage expression, was tested with a 25% threshold for positivity. Significant factors allowed dividing pts into favorable and unfavorable groups. Event free survival (EFS) studies were carried out for all binary variables using COX model. A univariate regression analysis was performed. Variables with a p<0.20 were included in multivariate analysis.
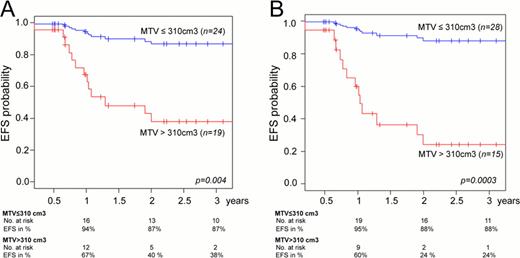
Median age and sex ratio (n=43) were respectively 29 y-o (16–77) and 0.87. ROC and univariate analysis showed that MTV, MTVa and MTVws were significant predictors for absence of complete remission (CR) at post-C2 and EFS. Cut-off values for prognosis (Cp) were 310 cm3 for MTV or MTVws and 53 cm3 for MTVa (p<0.001). Cut-off values for post-C2 were 244 cm3 for MTV or MTVws and 62 cm3 for MTVa (p<0.007). For pts with a large tumor volume (MTV, MTVws or MTVa > Cp), 1 and 2 years EFS were shorter (figure1). Two years EFS for MTV, MTVa and MTVws are respectively: 40%, 50% and 21% for large tumor volume and 87%, 86% and 89% for small tumor volume (p= 0.004, p=0.01 and p=0.0003). The mean SUVmax and heterogeneity were significant in univariate analysis (p=0.01 and p=0.04) but not in ROC analysis. Heterogeneity level was not correlated with CD68 expression. Each new parameter was compared, in multivariate analysis, to ESR, stages, B symptoms, bulky, age. MTV was an independent factor for predicting outcomes and post-C2 results (p<0.01) and better than mean SUV max. Similar results were found for MTVa and MTVws (p<0.02 and p<0.01).
In spite of limited number of pts and short follow-up, prognostic value of MTV is very significant. Those data are in accordance with the few results previously reported (Hutchings et al. Int J Radiat Oncol Biol Phys, 2005). Song et al. (Cancer Science, 2012) also highlighted that MTV was better predictor than SUVmax in DLBCL.
Large MTV seems to be a potential predictive marker for adverse post-C2 results and EFS. These data need further studies to confirm, in larger cohort, these first promising results to establish a better initial risk stratification of pts, leading to optimal adaptive therapy strategy.
EFS: MTV (A) for MTVws (B) (14 events).
No relevant conflicts of interest to declare.
Author notes
Asterisk with author names denotes non-ASH members.


This feature is available to Subscribers Only
Sign In or Create an Account Close Modal