Abstract
Abstract 2444
Multiple myeloma genomes are characterized by complex structural and numerical abnormalities. Proteasome inhibitors are routinely used to treat multiple myeloma. Despite significant clinical success with these agents, development of resistance often limits therapeutic benefit. However, many questions remain unanswered regarding the molecular mechanisms underlying acquired resistance to proteasome inhibitors.
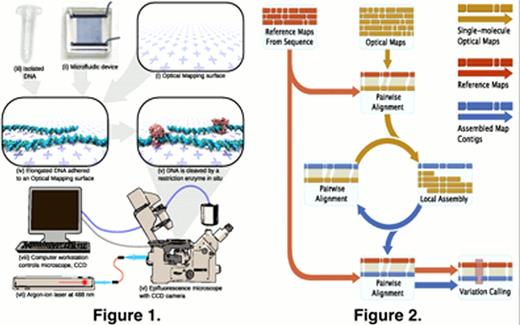
In order to understand the dynamics of structural evolution of the multiple myeloma genome under selective pressure afforded by proteasome inhibition and to identify targets to overcome acquired resistance, we derived global optical maps of two myeloma cancer genomes (DNA extracted from CD138+ tumor cells), obtained sequentially from the same patient before and after development of resistance to bortezomib, the prototypical therapeutic proteasome inhibitor. Optical Mapping offers a high throughput, single molecule, whole genome analysis that offers the highest rate of discovery of structural and numerical variants, free of the confounders associated with hybridization-based approaches. Briefly, the Optical Mapping System assembles entire genomes from large datasets of Rmaps (Rmap = a restriction-mapped individual genomic DNA molecule- see Figure 1) from which novel balanced and complex structural variants (2 kb – entire chromosomes) are discovered and tabulated by our pipeline (Figure 2).
We identified multiple structural variants including single nucleotide variations (SNVs), deletions, insertions, inversions, and loss of heterozygosity regions across the entire genome. Some of these variants are common to both bortezomib-sensitive and bortezomib-resistant genomes. We also discovered variants that were unique to the bortezomib resistant genome, implicating a role in acquisition of drug resistance. Many of these structural variants encompass genes, some of which have not been previously associated with multiple myeloma and bortezomib resistance, thus providing a rationale for further interrogation of these novel targets. In addition to novel potential targets, known recurrent events including del(13q) and a deletion spanning the CDKN2C/FAF1 locus on chromosome 1 were detected.
Future efforts are directed towards integration and correlation of optical maps with whole genome sequencing and transcriptional profiling as well as establishing the frequency of prioritized genomic perturbations in bortezomib-sensitive and –resistant patient populations. The integration of structural optical maps with base-pair sequence information and transcriptomic tracks will generate an entirely new view of the multiple myeloma cancer genome at a previously unseen resolution.
Overview of the Optical Mapping platform. Bulk microscope cover glass is cleaned with a strong acid, then treated with a silane mixture to make positively charged Optical Mapping surfaces (i). A silicon wafer is patterned with standard photolithography techniques, and then replicated into a flexible PDMS microfluidic device (ii) using soft lithography. Finally, pure, high molecular-weight DNA (iii) is isolated from cultured eukaryotic cells using a gentle detergent-based lysis protocol. The microfluidic device is adhered to the Optical Mapping surface, and the DNA solution is pumped through the microchannels, wherein the DNA is elongated and attached to the Optical Mapping surface via electrostatic interaction (iv). The DNA is incubated with a restriction endonuclease (v), which cleaves the DNA at its cognate sites. The cleaved DNA is stained and imaged on an epifluorescence microscope (vi) illuminated by an argon-ion laser (vii) and controlled by a computer workstation (viii).
Overview of the Optical Mapping platform. Bulk microscope cover glass is cleaned with a strong acid, then treated with a silane mixture to make positively charged Optical Mapping surfaces (i). A silicon wafer is patterned with standard photolithography techniques, and then replicated into a flexible PDMS microfluidic device (ii) using soft lithography. Finally, pure, high molecular-weight DNA (iii) is isolated from cultured eukaryotic cells using a gentle detergent-based lysis protocol. The microfluidic device is adhered to the Optical Mapping surface, and the DNA solution is pumped through the microchannels, wherein the DNA is elongated and attached to the Optical Mapping surface via electrostatic interaction (iv). The DNA is incubated with a restriction endonuclease (v), which cleaves the DNA at its cognate sites. The cleaved DNA is stained and imaged on an epifluorescence microscope (vi) illuminated by an argon-ion laser (vii) and controlled by a computer workstation (viii).
Overview of the map assembly pipeline. Reference maps are generated in silico from the NCBI Build 35 human genome reference sequence, and used to seed an iterative process of pairwise alignment (which clusters together similar single-molecule maps) and local assembly (which generates a consensus optical map from a cluster of single-molecule maps). After several iterations of alignment and assembly, the consensus maps are aligned back to the reference map and analyzed for places where the consensus map differs significantly from the reference.
Overview of the map assembly pipeline. Reference maps are generated in silico from the NCBI Build 35 human genome reference sequence, and used to seed an iterative process of pairwise alignment (which clusters together similar single-molecule maps) and local assembly (which generates a consensus optical map from a cluster of single-molecule maps). After several iterations of alignment and assembly, the consensus maps are aligned back to the reference map and analyzed for places where the consensus map differs significantly from the reference.
No relevant conflicts of interest to declare.
Author notes
Asterisk with author names denotes non-ASH members.


This feature is available to Subscribers Only
Sign In or Create an Account Close Modal