Abstract
Abstract 197
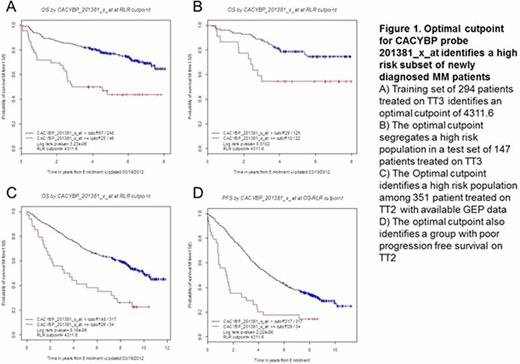
We and others have used gene expression profiling to classify multiple myeloma into high and low risk groups; here, we report the first combined GEP and proteomics study of a large number of baseline samples (n=85) of highly enriched tumor cells from patients with newly diagnosed myeloma. Peptide expression levels from MS data on CD138-selected plasma cells from a discovery set of 85 patients with newly diagnosed myeloma were used to identify proteins that were linked to short survival (OS < 3 years vs OS ≥ 3 years). The proteomics dataset consisted of intensity values for 11,006 peptides (representing 2,155 proteins), where intensity is the quantitative measure of peptide abundance; Peptide intensities were normalized by Z score transformation and significance analysis of microarray (SAM) was applied resulting in the identification 24 peptides as differentially expressed between the two groups (OS < 3 years vs OS ≥ 3 years), with fold change ≥1.5 and FDR <5%. The 24 peptides mapped to 19 unique proteins, and all were present at higher levels in the group with shorter overall survival than in the group with longer overall survival. An independent SAM analysis with parameters identical to the proteomics analysis (fold change ≥1.5; FDR <5%) was performed with the Affymetrix U133Plus2 microarray chip based expression data. This analysis identified 151 probe sets that were differentially expressed between the two groups; 144 probe sets were present at higher levels and seven at lower levels in the group with shorter overall survival. Comparing the SAM analyses of proteomics and GEP data, we identified nine probe sets, corresponding to seven genes, with increased levels of both protein and mRNA in the short lived group. In order to validate these findings from the discovery experiment we used GEP data from a randomized subset of the TT3 patient population as a training set for determining the optimal cut-points for each of the nine probe sets. Thus, TT3 population was randomized into two sub-populations for the training set (two-thirds of the population; n=294) and test set (one-third of the population; n=147); the Total Therapy 2 (TT2) patient population was used as an additional test set (n=441). A running log rank test was performed on the training set for each of the nine probe sets to determine its optimal gene expression cut-point. The cut-points derived from the training set were then applied to TT3 and TT2 test sets to investigate survival differences for the groups separated by the optimal cutpoint for each probe. The overall survival of the groups was visualized using the method of Kaplan and Meier, and a P-value was calculated (based on log-rank test) to determine whether there was a statistically significant difference in survival between the two groups (P ≤0.05). We performed univariate regression analysis using Cox proportional hazard model with the nine probe sets as variables on the TT3 test set. To identify which of the genes corresponding to these nine probes had an independent prognostic value, we performed a multivariate stepwise Cox regression analysis. wherein CACYBP, FABP5, and IQGAP2 retained significance after competing with the remaining probe sets in the analysis. CACYBP had the highest hazard ratio (HR 2.70, P-value 0.01). We then performed the univariate and multivariate analyses on the TT2 test set where CACYBP, CORO1A, ENO1, and STMN1 were selected by the multivariate analysis, and CACYBP had the highest hazard ratio (HR 1.93, P-value 0.004). CACYBP was the only gene selected by multivariate analyses of both test sets.
No relevant conflicts of interest to declare.
Author notes
Asterisk with author names denotes non-ASH members.


This feature is available to Subscribers Only
Sign In or Create an Account Close Modal