Abstract
Abstract 1925
In recent years, several pre-transplant models have been developed to predict the outcome after hematopoietic cell transplantation (HCT) through the selection of the best candidates and conditioning regimens. Two models are the most popular one each side of the Atlantic: the HCT Comorbidity Index (HCT-CI) and the European Blood and Marrow Transplantation (EBMT) score. Their predictive capacity has been demonstrated in several studies. Since these models are focused on different pre-HCT characteristics (HCT-CI on comorbidities and the EBMT score on more classical risk factors) we hypothesized that the combination of the two could improve their individual predictive capacity.
To that end, we retrospectively analyzed pre-HCT characteristics of all consecutive patients receiving a reduced-toxicity allogeneic HCT (allo-HCT) in 4 Spanish centers from 1999–2008. The HCT-CI and the EBMT scores were calculated as originally defined. Patients were then classified according to the HCT-CI in the original categoriesas originally defined and regardingto the EBMT score in two groups according to the median score of the whole cohort. Multivariate analyseis including pre-HCT characteristics were performed using Cox proportional Hazard models and taking into account the competitive risk structure. The predictive capacity of each model was calculated using the c-statistics. Patients were included in the same protocol of reduced-toxicity allo-HCT with fludarabine-based conditioning in combination with melphalan (70–140 mg/m2) or busulfan (8–10 mg/kg). The median follow-up for survivors was 51 months (range 3–123).
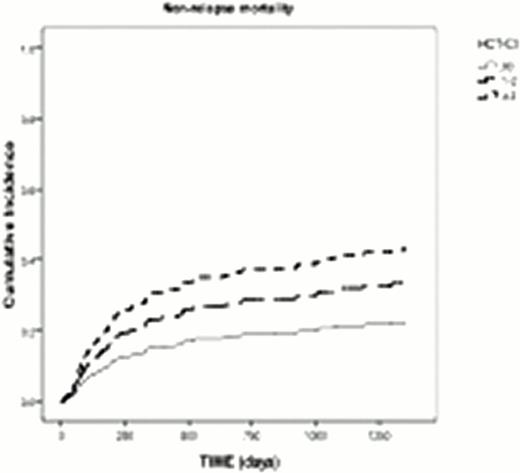
A total of 442 recipients (80% transplanted from HLA identical siblings) were included. Most frequent diseases were acute leukemia/MDS (n=156, 35%) and non-Hodgkin lymphoma/chronic lymphocytic leukemia (n=125, 28%). The HCT-CI score distribution was: score 0 (n=87, 20%), score 1–2 (n=130, 29%) and score ≥3 (n=225, 51%) while for the EBMT score was 0–2 (n=62, 14%), 3–4 (n=194, 44%) and >4 (n=187, 42%). The probability of 100-day Non-Relapse Mortality (NRM), 4y-NRM and 4y-overall survival (OS) for the whole cohort were 12% (95%CI 11–14), 35% (95%CI 33–38) and 45% (95%CI 48–50), respectively. In the multivariate analysis, the HCT-CI had and impact on 4y-NRM (score 0: HR 1.0; scores 1–2: HR 1.6 [95%CI 0.9–3], p=0.09; scores ≥ 3: HR 2.3 [95%CI 1.3–3.8], p=0.003) and 4y-OS (score 0:HR of death 1.0; scores 1–2: HR 1.3 [95%CI 0.8–2], p=0.2; scores >2: HR 1.9 [95%CI 1.3–2.8], p=0.002) while the EBMT score did not (p=0.4 and p=0.5, respectively).
Using the two models we classified the patients were classified into 3 groups: patients with low HCT-CI (0–2) and low EBMT score (<4) (Group 1), patients with high HCT-CI or high EBMT score (Group 2) and patients with both high HCT-CI and EBMT score (Group 3). The HR for 4y-NRM were: group 1 (HR 1.0), group 2 (HR 1.1 [95%CI 0.6–2], p=0.7), group 3 (HR 1.8 [95%CI 1–3], p=0.04) and for 4y-OS was: group 1 (HR 1.0), group 2 (HR 1 [95%CI 0.6–1.5], p=0.8), group 3 (HR 1.6 [95%CI 1–2.3], p=0.04).
Regarding the predictive capacity of each model, the HCT-CI alone captured 58% (c- 95%CI: 53–62), the EBMT score 54% (c- 95%CI: 51–58) while the combination of the two models captured 57% (c- 95%CI: 53–61) of the patients.
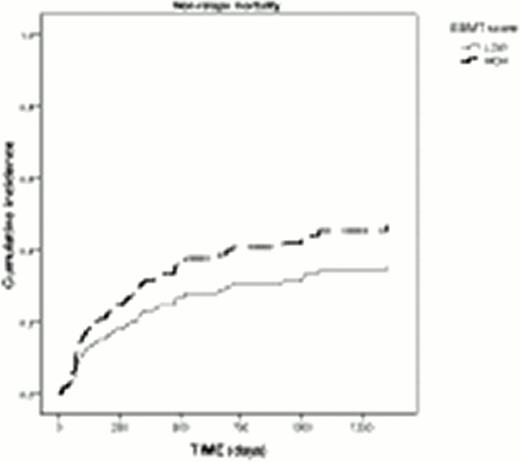
Finally, the impact of EBMT score was explored in each HCT-CI group. In patients with HCT-CI scores of 0 and 1–2, the EBMT score did not have an impact on NRM and OS. In the cohort of high HCT-CI score (>2), patients with low EBMT score showed a trend to lower risk of NRM (HR 0.6 [95%CI 0.3–1], p=0.08) with a similar risk as for patients with HCT-CI of 1–2 (Figure 1).
In conclusion, high HCT-CI scores but not high EBMT scores are associated with worse outcome in patients undergoing reduced toxicity allo-HCT. The addition of the EBMT score contributes little to the HCT-CI, except maybe for patients with more and severe comorbidities.
Probability of NRM according to the HCT-CI for all patients and according to the EBMT score in the 225 patients with HCT-CI >2 (MVA)
Probability of NRM according to the HCT-CI for all patients and according to the EBMT score in the 225 patients with HCT-CI >2 (MVA)
No relevant conflicts of interest to declare.
Author notes
Asterisk with author names denotes non-ASH members.


This feature is available to Subscribers Only
Sign In or Create an Account Close Modal