Abstract
The clinical management of patients with acute lymphoblastic leukemia (ALL) relies on accurate prediction of relapse hazard to determine the intensity of therapy and avoid over- or under-treatment.1 The measurement of minimal residual disease (MRD) during therapy has now emerged as the most important predictor of outcome in ALL.2 We developed the LymphoSIGHT platform, a high-throughput sequencing method, which universally amplifies antigen-receptor gene segments and can identify all leukemia-specific sequences at diagnosis, allowing monitoring of disease progression and clonal evolution during therapy. In this study, we determined the sensitivity and specificity of this method, delineated the extent of clonal evolution present at diagnosis, and compared its capacity to measure MRD to that of flow cytometry and allele-specific oligonucleotide PCR (ASO-PCR) in follow-up samples from >100 patients with ALL.
Using the sequencing assay, we analyzed diagnostic bone marrow samples from 100 ALL patients for clonal rearrangements of immunoglobulin (IgH@) and T cell receptor (TRB@, TRD@, TRG@) genes, as well as the extent of clonal evolution present at diagnosis. We assessed the capacity of the sequencing assay to detect MRD using diagnostic samples from 12 ALL patients carrying 13 leukemic IgH clonal rearrangements. Serial dilutions were prepared in normal peripheral blood mononucleated cells, at a range between <1 in 1 million to >1 in 1,000 cells. We also assessed MRD in follow-up samples from 106 ALL patients and analyzed concordance between MRD results obtained by the sequencing assay, flow cytometry and ASO-PCR.
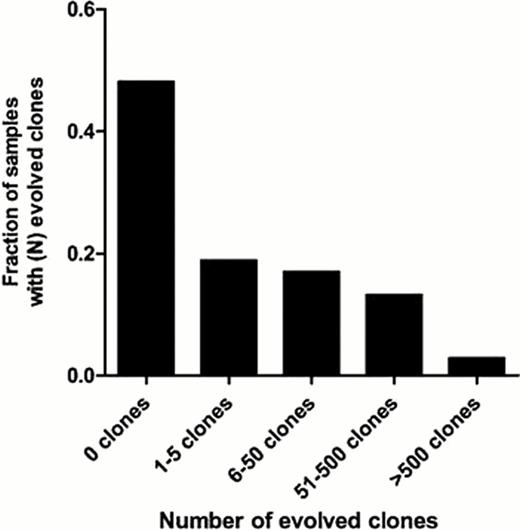
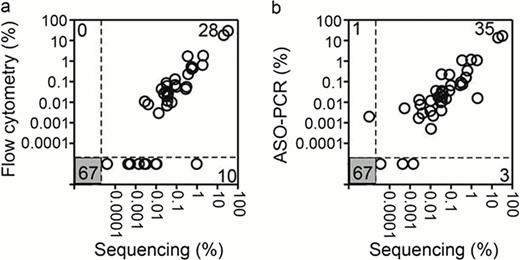
In diagnostic bone marrow samples, we detected the presence of a high-frequency clonal rearrangement of at least one receptor (“calibrating receptor”) in all the 100 ALL samples; 94 samples had at least 2 calibrating receptors at diagnosis, with 51 having 3 or more. We also detected a variable degree of clonal evolution: the number of evolved clones in each sample ranged from 0 to 6933, with 39 (37%) samples having 1–50 evolved clones and 17 (16%) >50 (Figure 1). In experiments with mixtures of normal and leukemic cells, the sequencing assay unequivocally and accurately detected leukemic signatures in all dilutions up to a concentration of at least one leukemic cell in 1 million leukocytes. In direct comparisons with established MRD assays performed on follow-up samples from patients with B-ALL, sequencing detected MRD in all 28 samples positive by flow cytometry, and in 35 of the 36 positive by ASO-PCR; it also revealed MRD in 10 and 3 additional samples that were negative by flow cytometry and ASO-PCR, respectively (Figure 2).
The sequencing assay is precise, quantitative, and can detect MRD at levels below 1 in 1 million leukocytes (0.0001%), i.e., represents sensitivity 1–2 orders of magnitude higher than standard flow cytometric and ASO-PCR methods. Our assay also allows monitoring of all leukemic rearrangements regardless of their prevalence at diagnosis, which abrogates the risk of false-negative MRD results due to clonal evolution. Finally, the sequencing assay utilizes a set of universal primers and does not require development of patient-specific reagents. These data, together with the results of our comparison with standard MRD assays in clinical samples, strongly support the use of the sequencing assay as a next-generation MRD test for ALL.
Clonal evolution at the IgH gene locus. Diagnostic samples containing a clonal gene rearrangement were categorized into 5 groups based on the number of evolved clones present in the diagnostic sample.
Clonal evolution at the IgH gene locus. Diagnostic samples containing a clonal gene rearrangement were categorized into 5 groups based on the number of evolved clones present in the diagnostic sample.
Comparison of MRD results obtained by sequencing, flow cytometry and ASO-PCR. The number of concordant measurements are shown in the lower left and upper right boxes and the number of discordant measurements are shown in the upper left and lower right boxes.
Comparison of MRD results obtained by sequencing, flow cytometry and ASO-PCR. The number of concordant measurements are shown in the lower left and upper right boxes and the number of discordant measurements are shown in the upper left and lower right boxes.
Faham:Sequenta: Employment, Equity Ownership, Research Funding. Zheng:Sequenta: Employment, Equity Ownership, Research Funding. Moorhead:Sequenta: Employment, Equity Ownership, Research Funding. Carlton:Sequenta: Employment, Equity Ownership, Research Funding.

This icon denotes a clinically relevant abstract
References:
Author notes
Asterisk with author names denotes non-ASH members.


This feature is available to Subscribers Only
Sign In or Create an Account Close Modal