Abstract
A unique subset of CD86− HSCs was previously discovered in mice that were old or chronically stimulated with lipopolysaccharide. Functionally defective HSCs were also present in those animals, and we now show that CD86− CD150+ CD48− HSCs from normal adult mice are particularly poor at restoring the adaptive immune system. Levels of the marker are high on all progenitors with lymphopoietic potential, and progressive loss helps to establish relations between progenitors corresponding to myeloid and erythroid lineages. CD86 represents an important tool for subdividing HSCs in several circumstances, identifying those unlikely to generate a full spectrum of hematopoietic cells.
Introduction
A large body of information exists about molecular mechanisms involved in maintaining HSC integrity, and many studies have identified unique markers associated with differentiation.1 However, several of these parameters differ between strains of mice or change dramatically according to developmental age, activation status, or inflammation.2-4 This issue gained importance with the realization that HSCs are normally heterogeneous and that functionally distinct subsets can be resolved according to phenotypes.5-8 As one example, we discovered that a unique population of lineage marker− Sca-1+ c-Kit+ (LSK) CD150+ CD48− HSCs lacked CD86.9 CD86− HSCs accumulated in old mice as well as young mice repeatedly injected with lipopolysaccharide (LPS). At least some HSCs in those animals had low ability to self-renew and restore the adaptive immune system when transplanted. In addition, HSCs in the chronically stimulated animals were abnormally in cycle.9 However, the relation between those phenomena and CD86 loss was unclear.
B7-1 (CD80) and B7-2 (CD86) are type I transmembrane proteins that were originally identified as ligands for CD28/CTLA-4.10 Murine CD80 and CD86 share ∼ 28% amino acid identity, but both are capable of using conserved binding sites to recognize either human or mouse CD28. Although this is important for T-cell activation, another ligand, CTLA-4 functions as an inhibitory receptor for immune responses.11 CD86 is constitutively expressed on dendritic cells, B cells, and thymic epithelial cells. CD80 is only expressed by activated B and T cells. Several reports suggest that CD80 and CD86 have overlapping functions because double knockout (KO) mice have more severe defects in immune responses than single KOs.12 However, one report suggests there are differential functions.13 Given the importance of CD80/86 for T-cell activation, blocking Abs are valuable in establishing tolerance during BM transplantation.14
Marrow stromal cells express the CD28 ligand in close proximity to B-lineage progenitors, and CD28 might slightly enhance B lymphopoiesis.15 CD86 is expressed by many HSCs,7,9 but gain or loss relative to hematopoiesis has not been explored. We now report that CD86 loss on stem and progenitor cells closely parallels their loss of lymphopoietic potential. It is a uniquely useful marker for appreciating functional heterogeneity among HSCs that are otherwise similar.
Methods
Mice
C57BL/6 (CD45.2 alloantigen), CD86-deficient (CD86−/−), and B6-SJL/Ly5.1 (CD45.1 alloantigen) mice were purchased from The Jackson Laboratory. C57BL/6 × SJL/Ly5.1 F1 (CD45.1 and CD45.2 alloantigens) and RAG1/GFP (recombinase activator gene 1/green fluorescent protein) knock-in mice were bred and maintained in the Laboratory Animal Resource Center at the Oklahoma Medical Research Foundation. PU.1fl/fl and C/EBPαfl/fl mice were bred with Mx1 Cre mice to generate PU.1fl/fl or C/EBPαfl/fl−Mx1 Cre mice. Those and C/EBPβKO mice were bred and maintained in Beth Israel Deaconess Medical Center. Some retired breeder mice (C57BL/6 and B6-SJL/Ly5.1; 4-6 months old) were purchased from The Jackson Laboratory and then maintained in our facility. All other animals were 8-16 weeks old, and male and female mice were used without sex discrimination. Experiments were performed in accordance with approved protocols from Oklahoma Medical Research Foundation Institutional Animal Care and Use Committee.
Isolation of cell populations and flow cytometry
Marrow cells were isolated from the long bones of donor mice, and erythrocytes were lysed in NH4Cl– hypotonic solution. To isolate progenitor populations for culture and transplantation, BM cells were enriched by negative selection by labeling BM with Gr-1 (RB6-8C5), CD11b/Mac-1 (M1/70), TER-119, CD3 (17A2), CD8 (53-6.7), CD19 (1D3), B220 (14.8), and then immunomagnetically depleted with the BioMag goat anti–rat IgG system (QIAGEN). All cells were treated with Fc-receptor block (2.4G2) before fluorescent staining and sorting. BM was stained in PBS with 3% FCS for 15 minutes on ice. Abs included CD3 (145-2C11), B220 (RA3-6B2), CD8, CD11b, TER-119, Gr-1, IgM (R6-60.2), NK1.1 (PK136), CD19, CD48 (HM48-1), CD135/Flt3 (A2F10), CD11c (HL3), CD34 (RAM34; BD PharMingen), FcγRII/III (93), CD150 (TC15-12F12.2), CD86 (GL1), CD45.1 (A20), CD45.2 (104), c-Kit (2B8), Sca-1 (D7), and IL-7Rα (A7R34). Secondary streptavidin PE-Cy7 was used for IL-7Rα staining. All Abs came from Biolegend, unless otherwise stated. Cells were sorted with the use of either a MoFlo (DakoCytomation) or FACSAria cytometer (BD Biosciences) into specific populations. Dead cells were excluded by propidium iodide staining (Molecular Probes). Purification of each subset was achieved by double sorting and confirmed by postsort analysis. For side population analysis, whole BM cells were resuspended in DMEM containing 2% FCS at 106 cells/mL and incubated with 5 μg/mL Hoechst 33342 for 90 minutes at 37°C. Flow cytometry was performed on a BD LSRII (BD Biosciences) and FlowJo Version 8.8.7 software (TreeStar) was used for data analysis. Gates for discriminating CD86+ cells were set according to whole BM or fluorescence minus one control.
Intravenous serial competitive transplantations
Recipient (CD45.1+CD45.2+ or CD45.1+) mice were lethally irradiated (2 × 6.5 Gy [650 rad]) with a 137Cs source (Mark I γ irradiator; J. L. Shepard and Associates). Mice were anesthetized with isoflurane (Isosol; Vedco), and cells were infused intravenously by retro-orbital injection. For purified HSC transplantations, HSCs were directly sorted into 96-well plates filled with rescue marrow cells (2 × 10⁵ cells/200 μL). Competitive repopulation was assessed at 4-week intervals by peripheral blood analysis. Primary F1 recipients were killed 6 months later, and total, multilineage hematopoietic contributions of the competing grafts were assessed in the BM and spleen of the F1 recipient mice. For secondary transplantations, 4-7 × 10⁶ pooled or individual whole marrow cells from primary recipients were transferred to secondary recipients in a similar fashion.
Peripheral blood preparations
Mice were briefly anesthetized with isoflurane, and ∼ 30 μL of peripheral blood was obtained from each mouse by retro-orbital bleeding with heparin-coated capillary tubes. Heparinized blood was emptied directly into glass centrifuge tubes containing 200 μL of a 2% Dextran solution and mixed thoroughly. The mixture was incubated for 20 minutes at 37°C to allow sedimentation of red blood cells. The upper white blood cell–enriched phase was retained, and cells were washed before brief resuspension in hypotonic NH4Cl− solution as an additional means of removing erythrocytes. The cells were washed and stained with fluorescent Abs before analysis by flow cytometry.
Cell cycle kinetics analyses
Single-cell suspensions of C57BL/6 marrow were fixed and permeabilized with the use of the BD Cytofix/Cytoperm kit (BD Biosciences) and stained intracellularly with FITC or PE anti–Ki-67 (B56) and MOPC-21 isotype control with Hoechst 33342 (Molecular Probes) at 20 μg/mL.
Serum-free, stromal cell–free cell cultures
Sorted cells were cultured in round-bottom 96-well plates (Corning Inc) with X-VIVO15 medium (Biowhittaker) containing 1% detoxified BSA (Stem Cell Technologies), 5 × 10⁻⁵M 2-mercaptoethanol, 2mM l-glutamine, 100 U/mL penicillin, and 100 mg/mL streptomycin. Culture medium was supplemented with 100 ng/mL FL, 2 ng/mL SCF, and 1 ng/mL IL-7 (Ebioscience). Incubation was maintained at 37°C in a 5% CO2 humidified atmosphere. Cells were fed by replacing half culture volumes with fresh media and cytokines every 3-4 days. Cells were harvested at designated times and stained with mAbs to CD19, B220, CD11c, Ly6c, CD11b/Mac-1, and NK1.1.
Nonlymphoid progenitor cultures
CD150+ CD48− Flt3− HSCs were sorted and placed in Methocult cultures (StemCell Technologies). Colonies were counted and scored after 9 days of incubation.
Statistics
Prism Version 3.02 software (GraphPad) was used for statistical analysis. Unpaired, 2-tailed t test analyses were used for intergroup comparisons, and P values were considered significant if < .05.
Results
CD86− HSCs correspond to myeloid-biased HSCs defined by phenotype and are relatively quiescent
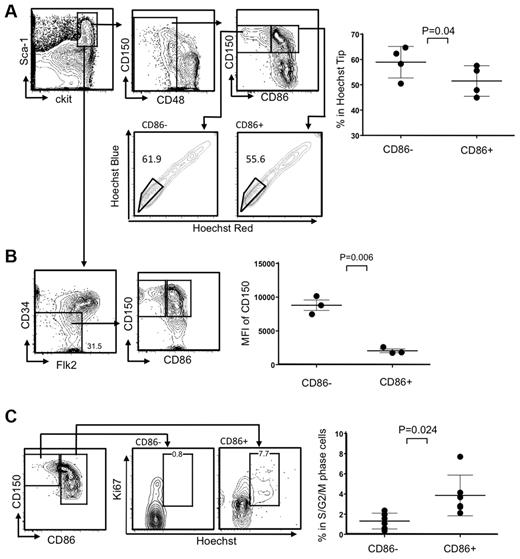
HSC-enriched LSKs in young mice almost uniformly express CD86, but a marker-negative population greatly expands in old mice or mice chronically treated with LPS.9 HSC functions were compromised in these circumstances, and we asked if this corresponded to recent studies relating to HSC heterogeneity and used 8- to 10-month-old mice for this purpose. For example, it was shown that myeloid-biased HSCs can be enriched according to their capacity for Hoechst dye efflux in combination with canonical HSC markers.8 We found that significantly higher percentages of CD86− HSCs were included in this “side population tip” relative to the CD86+ cohort, indicating they may represent myeloid-biased HSCs (Figure 1A). HSC subsets can also be resolved according to expression of CD150, where some CD150Hi HSCs are myeloid biased.16 We observed that CD86− HSCs have high densities of CD150, reflected in mean fluorescence intensities (MFI; Figure 1B; data not shown). This was true regardless of whether CD34 or Flt3 was used as HSC-gating parameters within the LSK fraction.
The CD86− subset of HSCs efflux Hoechst dye, express high levels of CD150, and are quiescent. (A) CD150+ CD48− LSKs were gated and further divided into HSC subsets on the basis of CD86 expression (top left). The bottom panels show moderate-to-high exclusion of Hoechst dye (boxes). The latter population is also known as “side population tip.” HSCs from individual mice in 3 independent experiments were analyzed in this way (n always > 3), and the results are given in the right panel. (B) Absence of CD34 and Flk2 are also defining characteristics of true stem cells, and populations gated in this way include the CD86− subset (contour plots on left). MFIs for CD150 staining are given in the right panel, showing that levels are significantly higher on CD86− HSCs. (C) Ki-67 and DNA staining showed that CD86− HSCs in normal mice are not dividing. Representative plots are shown on the left side, whereas results for 6 individual mice are shown on the right.
The CD86− subset of HSCs efflux Hoechst dye, express high levels of CD150, and are quiescent. (A) CD150+ CD48− LSKs were gated and further divided into HSC subsets on the basis of CD86 expression (top left). The bottom panels show moderate-to-high exclusion of Hoechst dye (boxes). The latter population is also known as “side population tip.” HSCs from individual mice in 3 independent experiments were analyzed in this way (n always > 3), and the results are given in the right panel. (B) Absence of CD34 and Flk2 are also defining characteristics of true stem cells, and populations gated in this way include the CD86− subset (contour plots on left). MFIs for CD150 staining are given in the right panel, showing that levels are significantly higher on CD86− HSCs. (C) Ki-67 and DNA staining showed that CD86− HSCs in normal mice are not dividing. Representative plots are shown on the left side, whereas results for 6 individual mice are shown on the right.
Although HSCs do not proliferate abnormally in aged mice, this was a characteristic of HSCs recovered from chronically LPS-treated young animals.9 In other contexts, integrity and potency have corresponded to deep quiescence,17 and we assessed this parameter in CD86− HSCs (Figure 1C). Staining with the Ki67 proliferation-associated Ag and Hoechst dye showed almost no CD86− HSCs in S+G2/M stages of the cell cycle, whereas a small subset of CD86+ HSCs were dividing (Figure 1C). Thus, CD86− HSCs are quiescent and resemble subsets previously thought to be poor at replenishing the adaptive immune system.
CD86− HSCs are defective with respect to lymphopoiesis and less robust in transplantation assays
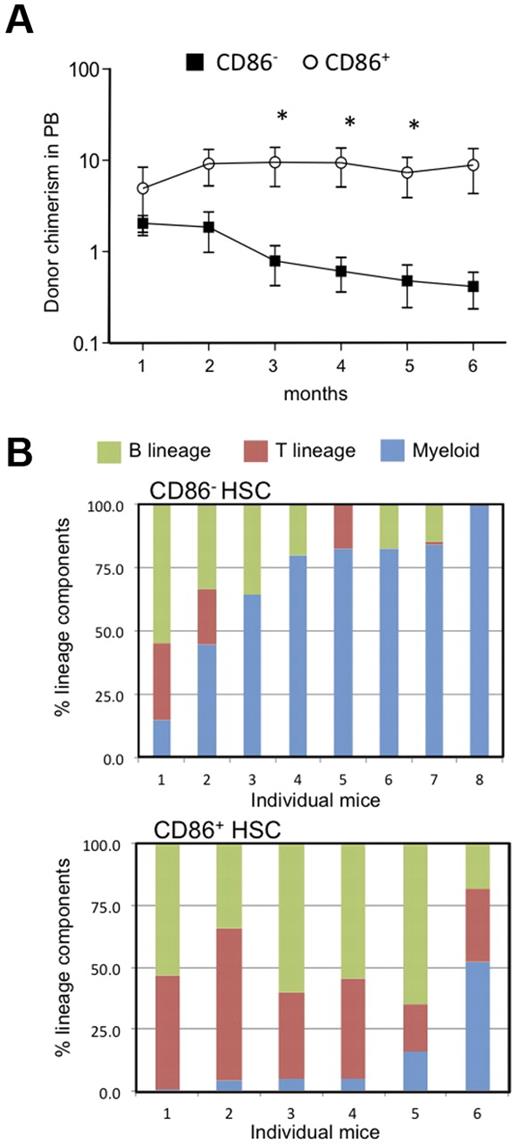
The results described above suggested that CD86− HSCs might have low lymphopoietic potential, so we formally tested that in transplantation experiments. Twenty CD86+ or CD86− CD150+ CD48− LSKs were transferred to lethally irradiated recipients along with CD45 distinct, whole BM to provide rescue cells (Figure 2). Long-term (6 months) multilineage engraftment (B, T, and myeloid cells) was observed in animals receiving either HSC subset, showing that both populations contain functional HSCs. However, numbers of blood cells generated from CD86− HSCs declined over time, whereas those derived from CD86+ HSCs were more stable (Figure 2A). Furthermore, the patterns of reconstitution were quite different. CD86+ HSCs gave rise to peripheral blood B and T lymphocytes as well as low numbers of myeloid cells (Figure 2B). This was the case in all of 6 individual recipients that were analyzed separately. In contrast, myeloid cells predominated in 6 of 8 recipients of CD86− HSCs. Thus, CD86 denotes lymphoid/myeloid bifurcation in some HSCs.
CD86− HSCs effectively engrafted the CD150+ CD48− LSK compartment in transplant recipients but produced fewer blood cells and especially B lymphocytes than the CD86+ cohort. (A) Subsets of CD150+ CD48− LSK stem cells were resolved and sorted according to CD86 expression. Twenty of each subset were transplanted separately to lethally irradiated recipients along with 2 × 10⁵ whole BM rescue cells. Chimerism with respect to phenotypically defined HSCs was found 6 months later. Not shown are data points for 3 mice in each group in which chimerism was < 0.01%. Peripheral blood samples were tested at monthly intervals, and percentages of donor type cells are shown for CD86+ (open circles) and CD86− (closed squares) HSC transplant recipients. Statistically significant (*P = < .05) differences were found from the third month. (B) The bars show percentages of the donor type cells that expressed myeloid, (GR-1 and/or CD11b), B (B220 plus CD19) or T (CD3) lineage markers in the blood of individual recipients. Note that myeloid cells predominated in 6 of 8 recipients of CD86− HSCs, whereas CD86+ HSCs were balanced or lymphoid skewed.
CD86− HSCs effectively engrafted the CD150+ CD48− LSK compartment in transplant recipients but produced fewer blood cells and especially B lymphocytes than the CD86+ cohort. (A) Subsets of CD150+ CD48− LSK stem cells were resolved and sorted according to CD86 expression. Twenty of each subset were transplanted separately to lethally irradiated recipients along with 2 × 10⁵ whole BM rescue cells. Chimerism with respect to phenotypically defined HSCs was found 6 months later. Not shown are data points for 3 mice in each group in which chimerism was < 0.01%. Peripheral blood samples were tested at monthly intervals, and percentages of donor type cells are shown for CD86+ (open circles) and CD86− (closed squares) HSC transplant recipients. Statistically significant (*P = < .05) differences were found from the third month. (B) The bars show percentages of the donor type cells that expressed myeloid, (GR-1 and/or CD11b), B (B220 plus CD19) or T (CD3) lineage markers in the blood of individual recipients. Note that myeloid cells predominated in 6 of 8 recipients of CD86− HSCs, whereas CD86+ HSCs were balanced or lymphoid skewed.
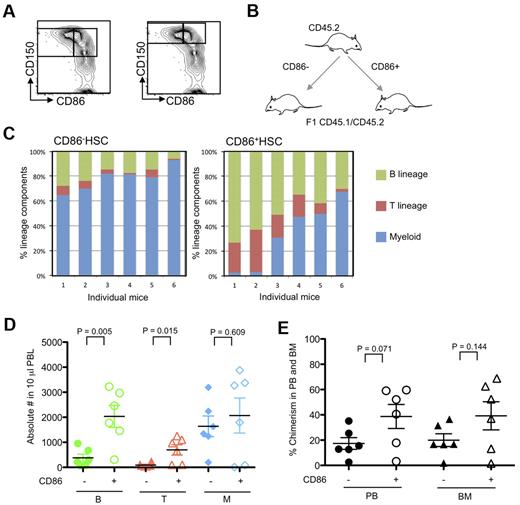
Almost all CD86− HSCs have a distinctive high density of CD150, whereas CD86+ HSCs are equally distributed in CD150Hi and CD150Lo populations (Figure 1B). Therefore, it seemed possible that CD150 density rather than CD86 expression was the determining factor for myeloid bias. Consequently, CD150Hi HSCs were sorted according to CD86 from 10-month-old mice and then assessed in transplantation assays (Figure 3). Our sort threshold for CD150 was set to be similar to one described in a published report16 and is shown in Figure 3A. A design was used in which 200 of CD45.2 CD86+ CD150Hi HSCs or the companion CD86− subset were transferred to lethally irradiated (CD45.1/CD45.2) F1 recipient mice (Figure 3B). In each group, 2 × 10⁵ un-separated marrow cells of host type were also given to provide rescue and competition. Although all blood cell types were generated for ≥ 6 months from both CD150Hi HSC subsets, strong lymphopoietic potential was only evident in all recipients of CD86+ HSCs (Figure 3C). In fact, absolute numbers of B and T cells were significantly reduced in peripheral blood of CD86− HSC recipients (Figure 3D). The BM and peripheral blood of mice that received a transplant was then examined 6 months after transplantation (Figure 3E). Chimerism was lower in recipients of CD86− HSCs than in those that received the companion CD86+ subset. A slightly different experimental design was then used, whereby the CD45.1 or CD45.2 CD86+ CD150Hi HSCs were mixed with an equal number of CD45 distinct CD86− CD150Hi HSCs and transferred along with (CD45.1/CD45.2) F1 BM cells to lethally irradiated recipients (supplemental Figure 1A, available on the Blood Web site; see the Supplemental Materials link at the top of the online article). This approach allowed the HSC subsets to reside together and minimized any potential influence of CD45.1 versus CD45.2 differences. Again, CD86− HSCs had significantly reduced lymphopoietic potential (supplemental Figure 1B-D). The declining chimerism characteristic of this population in primary recipients was not reversed in most recipients when marrow was recovered and transplanted a second time (supplemental Figure 2). Despite very low numbers of donor type cells and considerable mouse-to-mouse variation, CD86− HSCs generated significantly fewer B-lineage lymphocytes.
CD86 expression distinguishes HSCs with full differentiation potential among those with high CD150. (A) Sorting threshold of CD150+ and CD150Hi CD48− LSK cells are shown as right and left panels, respectively. CD86− and CD86+ CD150Hi HSCs were sorted from 10-month-old mice. (B) Schematic representation of transfer experiments. Two hundred CD86− and CD86+ CD150Hi HSCs (CD45.2) were transplanted separately into CD45.1/CD45.2 F1 mice along with 2 × 10⁵ whole BM cells. (C) Five months later, peripheral blood samples were stained with anti-CD11b, Gr-1, B220, CD19, CD3e, NK1.1, CD45.1, CD45.2, and propidium iodide. Lymphoid cells predominated in recipients of CD86+ HSCs compared with CD86− HSCs (P < .001). (D) Absolute numbers of lymphocytes in peripheral blood (PBL) of recipients of CD86− HSCs (closed symbols) and CD86+ (open symbols) were indicated as green (B cells), red (T cells), and blue (myeloid cells). (E) Chimerism of donor cells in peripheral blood (PB) and BM are indicated with circles and triangles. Donor cells from CD86− and CD86+ cells are indicated as closed and open symbols, respectively.
CD86 expression distinguishes HSCs with full differentiation potential among those with high CD150. (A) Sorting threshold of CD150+ and CD150Hi CD48− LSK cells are shown as right and left panels, respectively. CD86− and CD86+ CD150Hi HSCs were sorted from 10-month-old mice. (B) Schematic representation of transfer experiments. Two hundred CD86− and CD86+ CD150Hi HSCs (CD45.2) were transplanted separately into CD45.1/CD45.2 F1 mice along with 2 × 10⁵ whole BM cells. (C) Five months later, peripheral blood samples were stained with anti-CD11b, Gr-1, B220, CD19, CD3e, NK1.1, CD45.1, CD45.2, and propidium iodide. Lymphoid cells predominated in recipients of CD86+ HSCs compared with CD86− HSCs (P < .001). (D) Absolute numbers of lymphocytes in peripheral blood (PBL) of recipients of CD86− HSCs (closed symbols) and CD86+ (open symbols) were indicated as green (B cells), red (T cells), and blue (myeloid cells). (E) Chimerism of donor cells in peripheral blood (PB) and BM are indicated with circles and triangles. Donor cells from CD86− and CD86+ cells are indicated as closed and open symbols, respectively.
Clonal assays were then used to assess the potential of HSC subsets to generate nonlymphoid cells (supplemental Figure 3). CD86+ HSCs consistently had increased ability to generate granulocyte-macrophage colonies, but the magnitude of change was small, and clonal proliferation was in all other respects similar. Thus, CD86 loss has little if any correlation with progression in nonlymphoid lineages.
These results indicate that CD86− HSCs can engraft BM of irradiated recipients and produce blood cells in that site for ≥ 6 months. However, they were less robust over time and had less lymphopoietic potential than CD86+ HSCs with otherwise similar staining characteristics. Thus, it may be superior to other markers for assessing HSC integrity.
CD86 is retained during early stages of B lymphopoiesis
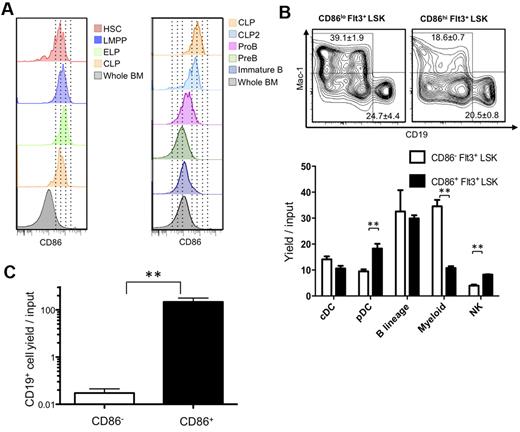
CD86 had not been previously used as a stem cell differentiation marker, and we considered that it might be valuable for discriminating early commitment events. Therefore, we traced its expression on normal BM progenitors previously defined by flow cytometry with young (8- to 16-week-old) mice. Transcription from the RAG1 locus marks some of the most primitive lymphoid primed progenitors in BM.18 These early lymphoid progenitors (ELPs), identified as Lin− c-KitHi Flt3+ RAG1/GFP+ cells in RAG1/GFP knock-in mice displayed high levels of CD86 (Figure 4A; progenitor definition shown in supplemental Figure 4). The same was true for lymphoid-primed multipotent progenitors (LMPPs) gated as Lin− Flt3Hi c-Kit+ Sca-1Lo and/or VCAM-1Lo as well as Lin− Flt3+ IL-7Rα+ c-Kit+ Sca-1Lo CLPs (common lymphoid progenitors; Figure 4A; data not shown).19-21
HSCs lose CD86 as they give rise to progenitors lacking lymphopoietic potential. (A) Multiparameter flow cytometry was used to resolve HSC-rich LSK (CD150+ CD48−), as well as LMPP (Flt3Hi, CD150− Rag1GFP− LSK), ELP (Flt3Hi, CD150− Rag1GFP+), CLP (Lin−, Flt3+, IL-7Rα+, ckit+), CLP2 (Ly6C−, NK1.1−, IgM−, B220+, Flt3+, IL-7Rα+), ProB (Ly6C−, NK1.1−, IgM−, B220+, CD43+, CD19+), PreB (Ly6C−, NK1.1−, IgM−, B220+, CD43−, CD19+), and immature B (Ly6C−, NK1.1−, IgM+, B220+, CD19+) cells. (B) Down-regulation of CD86 corresponds to decreased myeloid potential and then absence of competence for lymphopoiesis. The lymphoid primed Lin− Flt3Hi Sca-1+ c-KitHi subset (LMPP) was subdivided according to CD86 and placed in defined, serum-free, stromal cell-free cultures for 14-16 days. Flow cytometric analysis was then performed (top panels), and the results were calculated as yields per input progenitor (histograms). (C) A slightly less primitive Lin− c-Kit+ fraction lacking Sca-1+ and c-KitHi progenitors was sorted according to CD86 and cultured for 10 days. Statistically significant differences are indicated by asterisks (**P ≤ .01). Similar results were obtained in 3 independent experiments.
HSCs lose CD86 as they give rise to progenitors lacking lymphopoietic potential. (A) Multiparameter flow cytometry was used to resolve HSC-rich LSK (CD150+ CD48−), as well as LMPP (Flt3Hi, CD150− Rag1GFP− LSK), ELP (Flt3Hi, CD150− Rag1GFP+), CLP (Lin−, Flt3+, IL-7Rα+, ckit+), CLP2 (Ly6C−, NK1.1−, IgM−, B220+, Flt3+, IL-7Rα+), ProB (Ly6C−, NK1.1−, IgM−, B220+, CD43+, CD19+), PreB (Ly6C−, NK1.1−, IgM−, B220+, CD43−, CD19+), and immature B (Ly6C−, NK1.1−, IgM+, B220+, CD19+) cells. (B) Down-regulation of CD86 corresponds to decreased myeloid potential and then absence of competence for lymphopoiesis. The lymphoid primed Lin− Flt3Hi Sca-1+ c-KitHi subset (LMPP) was subdivided according to CD86 and placed in defined, serum-free, stromal cell-free cultures for 14-16 days. Flow cytometric analysis was then performed (top panels), and the results were calculated as yields per input progenitor (histograms). (C) A slightly less primitive Lin− c-Kit+ fraction lacking Sca-1+ and c-KitHi progenitors was sorted according to CD86 and cultured for 10 days. Statistically significant differences are indicated by asterisks (**P ≤ .01). Similar results were obtained in 3 independent experiments.
CD86 is known to be displayed on activated mature B cells,11 but we found that it was down-regulated at later stages of B lymphopoiesis. That is, CD86 densities were gradually reduced on most c-Kit− progenitors, including Ly-6C− NK1.1− B220+ CD19− CD43+ sIgM− pre-proB cells, CD19+ B220+ CD43+ ProB cells, and small CD19+ B220+ CD43− PreB cells (Figure 4A). An exception was c-Kit− Flt3+ IL-7Rα+ CLP2.22 CD86 was also low to absent on most Lin− CD25− CD44Hi c-Kit+ early thymic progenitors.23
An early restriction in differentiation options parallels high expression of the Flt3 receptor.19,24 Megakaryocyte and erythroid potentials markedly decline, and LSKs with high amounts of Flt3 are enriched for LMPP.19,24 Therefore, we asked if quantitative differences in CD86 among Flt3Hi LMPPs could predict differentiation potential. The category was sorted into CD86 low and high subsets that were then placed in defined, serum-free, stromal cell-free cultures (Figure 4B). Both populations included progenitors capable of generating conventional dendritic cells (DCs), plasmacytoid DCs, natural killer (NK) cells, B-lineage lymphocytes, and myeloid cells (progenitor definition shown in supplemental Figure 4). However, the CD86Lo subset had markedly increased competence to generate TER119− CD41− CD19− CD11c− Gr-1+ CD11b/Mac-1+ myeloid cells. In addition, CD86Hi progenitors were significantly better sources of plasmacytoid DCs and NK cells.
We then asked if progenitors that down-regulate CD86 still have lymphopoietic potential (Figure 4C). Lin− c-Kit+ cells were sorted to specifically exclude the Sca-1+ c-KitHi fraction (sort strategy shown in supplemental Figure 4). That is, HSCs, MPPs, LMPPs, and ELPs normally included in this LSK subset were discarded. The remaining cells were subdivided according to CD86 expression and placed in defined, serum-free, stromal cell-free cultures supplemented with IL-7, SCF, and Flt3 ligand. Although the CD86+ subset was a potent source of B-lineage lymphocytes, this activity was absent from the CD86− cohort.
These results suggest that down-regulation of CD86 on the most primitive progenitors predicts diminished ability to restore the adaptive immune system. Discarding cells that completely lack this marker represents an effective strategy for enriching for lymphopoietic progenitors. Although present at high levels on CLPs, the marker is down-regulated as lymphopoiesis proceeds. This information also suggests differentiation stages that might be influenced by CD86 ligands.
Declining densities of CD86 on stem/progenitors correlate with nonlymphoid lineage progression
An initial finding was that, although the HSC-enriched LSK fraction showed uniformly high CD86, densities were low on primitive myeloerythroid progenitors including megakaryocyte-erythrocyte progenitors, common myeloid progenitors, and granulocyte-monocyte progenitors (supplemental Figure 5A). All of these nonlymphoid progenitors are defined on the basis of low Sca-1 density.25 Therefore, it is noteworthy that we found a good correlation between Sca-1 and CD86 on Lin− c-kitHi marrow cells (supplemental Figure 5B). Consistent with a previous report,26 common dendritic progenitors were CD86− (supplemental Figure 5C).
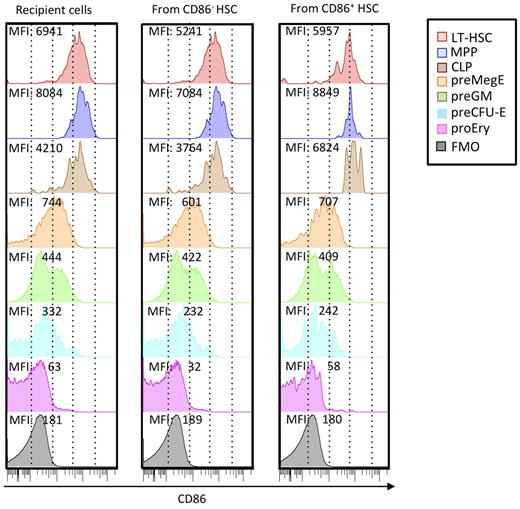
Substantial progress has been made in defining stages in myeloerythroid differentiation.27 Therefore, we used these newly developed staining protocols to track changes in CD86 density (Figure 5). We consistently found that CD150− Flt3+ MPPs had more CD86 than CD150+ Flt3− HSCs (Figure 5 left column) as reflected in MFI. This may reflect the presence of progenitors in that fraction capable of generating IL-7Rα+ Flt3+ c-Kit+ CLPs. CD150+ CD105− Sca-1− c-Kit+ CD41− FcγRII/III− PreMegEs had substantially less CD86. A CD150− CD105− Sca-1− preGM fraction was heterogeneous with respect to CD86 levels, suggesting a further transition was occurring. CD150+ CD105+ Sca-1− pre-CFU-E and CD150− CD105+ Sca-1− ProEry subsets represent further down-regulation of CD86.
CD86 is progressively down-regulated with progression in nonlymphoid lineages and may be re-acquired by hematopoietic cells arising from transplanted CD86− CD150Hi HSCs. HSC subsets distinguishable by CD45 alleles were sorted 3 times to > 99% purity as shown in Figure 3, and 200 cells were transplanted together into lethally irradiated recipients. Six months later, donor and recipient cells of the 2 types were recovered from BM and resolved according to the differentiation scheme of Pronk et al.27 Each histogram is color coded according to subset, and MFIs of CD86 staining are given. Recipient cells closely resemble those in normal mice that did not receive a transplant, and similar results were obtained with HSC subsets transplanted into separate recipients. Background staining (fluorescence minus one; FMO) is also shown in each column.
CD86 is progressively down-regulated with progression in nonlymphoid lineages and may be re-acquired by hematopoietic cells arising from transplanted CD86− CD150Hi HSCs. HSC subsets distinguishable by CD45 alleles were sorted 3 times to > 99% purity as shown in Figure 3, and 200 cells were transplanted together into lethally irradiated recipients. Six months later, donor and recipient cells of the 2 types were recovered from BM and resolved according to the differentiation scheme of Pronk et al.27 Each histogram is color coded according to subset, and MFIs of CD86 staining are given. Recipient cells closely resemble those in normal mice that did not receive a transplant, and similar results were obtained with HSC subsets transplanted into separate recipients. Background staining (fluorescence minus one; FMO) is also shown in each column.
Although these findings suggest a sequence of normal nonlymphoid differentiation, they do not indicate if it is unidirectional. CD86+ HSCs gradually lost the marker in short-term cultures, but there was no evidence for re-acquisition by CD86− HSCs (data not shown). We also examined HSCs recovered from long-term transplant recipient mice (Figure 5 middle and right columns). Surprisingly, HSCs from mice that received a transplant with sorted CD86− HSCs had low levels of this marker. The same was true for CLP and myeloerythroid subsets. It is possible that robust CD86+ HSCs contaminating the transplanted fraction expanded in the transplant recipients. However, the CD86− HSCs went through 3 cycles of cell sorting and exceeded 99% purity. Furthermore, they exhibited the reduced expansion and lymphopoiesis typical of this fraction (Figures 2–3).
We conclude that down-regulation of CD86 provides milestones for nonlymphoid differentiation. This is consistent with the fact that CD86− HSCs have poor lymphopoietic potential, as typical of HSCs in aged mice. However, the marker may be slowly re-acquired in some circumstances.
CD86 can be used to subdivide hematopoietic progenitors in fetal liver and in Balb/c mice
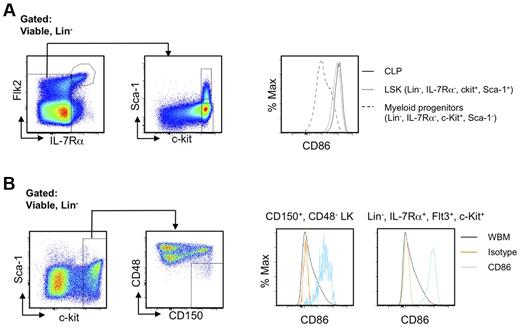
Definitive hematopoiesis in the fetal liver differs significantly from the adult process.28 When E14.5 fetal liver cells of C57BL6 mice and traditional markers of fetal liver hematopoietic stem/progenitor cells and committed progenitors were used, essentially identical results were obtained as in adult BM cells, in which LSK and CLP express CD86, and myeloid/erythroid progenitors do not (Figure 6A). We also correlated CD86 expression with current stem cell markers and lymphoid progenitors in Balb/c mice. Although these markers are infrequently used with non-C57BL/6 mice,2 HSCs are probably in the Lin− CD150+ CD48− c-Kit+ fraction,6 whereas CLPs reside within the Lin− Flt3+ IL-7Rα+ c-Kit+ category.21 We found that both of these populations displayed high densities of CD86 (Figure 6B). Therefore, CD86 can be used to trace HSCs and lymphoid committed progenitors in fetal liver as well as in non-C57BL6 strain mice. Sca-1, c-Kit, CD34, and CD11b are all known to be dysregulated during inflammation or rebound from myeloablation.3,29 In contrast, CD150+, CD48−, and CD86+ cells are easily detected in all of those situations (data not shown). We conclude that CD86 can be an extremely valuable sort parameter for stem and progenitor cells and even under diverse conditions.
CD86 is useful for discriminating stem/progenitor cells regardless of mouse strain and developmental age. (A) LSK as well as lymphoid and myeloid progenitors in E14.5 fetal liver of C57BL6 mice were identified by flow cytometry. The histograms show selective expression of CD86. (B) Lin−, CD150+, CD48−, c-Kit+ HSCs in BM of Balb/c mice were gated as shown (left panels). Single parameter histograms to the right show CD86 expression. Similar results for lymphoid progenitors defined as Lin−, Flt3+, IL-7Rα+, c-Kit+ are shown in the far right panel, along with whole BM (WBM).
CD86 is useful for discriminating stem/progenitor cells regardless of mouse strain and developmental age. (A) LSK as well as lymphoid and myeloid progenitors in E14.5 fetal liver of C57BL6 mice were identified by flow cytometry. The histograms show selective expression of CD86. (B) Lin−, CD150+, CD48−, c-Kit+ HSCs in BM of Balb/c mice were gated as shown (left panels). Single parameter histograms to the right show CD86 expression. Similar results for lymphoid progenitors defined as Lin−, Flt3+, IL-7Rα+, c-Kit+ are shown in the far right panel, along with whole BM (WBM).
CD86 is dispensable for normal hematopoiesis
We considered that CD86−/− mice might have hematopoietic abnormalities. However, rigorous flow cytometric analyses of BM found no differences from wild-type mice (supplemental Table 1). In addition, sorted HSCs from CD86−/− mice generated a full spectrum of cell types when transplanted (supplemental Figure 6).
Regulation of CD86 expression in primitive hematopoietic cells
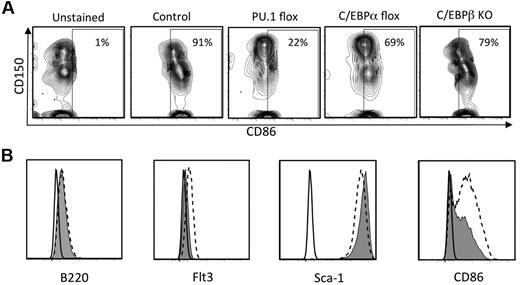
Given that CD86 density corresponds to early segregation of hematopoietic lineages and competence to produce lymphocytes, it was important to gain insight into its regulation. A recent report concluded that the transcription factor PU.1 is needed for acquisition of CD86 by maturing DCs.30 Therefore, we conditionally deleted PU.1 from normal adult mice and assessed expression of CD86 on BM cells (Figure 7A). CD86 was almost completely lost when PU.1fl/fl × Mx1Cre+ mice were treated with poly IC, whereas no changes were recorded in control PU.1fl/fl mice. In contrast, the marker was less affected by conditional targeting of C/EBPα or in total KOs of C/EBPβ.
CD86 expression is regulated by PU.1 and to a lesser extent by C/EBPα and C/EBPβ. (A) PU.1fl/fl × Mx Cre F1 mice, C/EBPαfl/fl × MxCre F1 mice were injected with poly IC intraperitoneally. Four days after the last injection, CD150+ CD48− LSK cells in the BM were analyzed by flow cytometry. HSC-rich LSK cells from BM of global C/EBPβ KO mice were similarly analyzed. (B) shRNA knockdown of PU.1 in a Pax5−/− pre-pro-B cell line reduces CD86 expression. The Pax5−/− cell line31 was transduced with lentiviral supernatant fluids containing either a no-template control (NT-shRNA) or PU.1-targeted shRNA as previously described.32 Puromycin-resistant cells were harvested and analyzed for surface expression of the indicated markers by flow cytometry. The black lines indicate background fluorescence of unstained cells, the hatched lines reflect staining of cells transduced with the NT-shRNA, and the filled histograms show staining of cells transduced with the PU.1-shRNA.
CD86 expression is regulated by PU.1 and to a lesser extent by C/EBPα and C/EBPβ. (A) PU.1fl/fl × Mx Cre F1 mice, C/EBPαfl/fl × MxCre F1 mice were injected with poly IC intraperitoneally. Four days after the last injection, CD150+ CD48− LSK cells in the BM were analyzed by flow cytometry. HSC-rich LSK cells from BM of global C/EBPβ KO mice were similarly analyzed. (B) shRNA knockdown of PU.1 in a Pax5−/− pre-pro-B cell line reduces CD86 expression. The Pax5−/− cell line31 was transduced with lentiviral supernatant fluids containing either a no-template control (NT-shRNA) or PU.1-targeted shRNA as previously described.32 Puromycin-resistant cells were harvested and analyzed for surface expression of the indicated markers by flow cytometry. The black lines indicate background fluorescence of unstained cells, the hatched lines reflect staining of cells transduced with the NT-shRNA, and the filled histograms show staining of cells transduced with the PU.1-shRNA.
A wide range of progenitors depend on PU.1,30,33 and it seemed possible that CD86 on stem/progenitor cells might be indirectly affected. For example, if PU.1+ macrophage-like cells are needed to maintain niches in BM,34 their deletion would cause secondary loss of CD86-expressing stem cells. Therefore, we used shRNAs to deplete PU.1 from a Pax5−/− pre-pro-B cell line that constitutively expresses CD86. Levels of Flt3 were reduced as expected, because it is known to depend on PU.1.30 Importantly, the density of CD86 also declined (Figure 7B). Even though Sca-1 parallels levels of CD86 on some progenitors (supplemental Figure 5B), Sca-1 was unaffected by diminished PU.1.
We conclude that PU.1 is necessary for CD86 display, whereas C/EBPα and C/EBPβ are less important. Further study should reveal how transcription factors cooperate to promote and repress activation of the CD86 locus.
Discussion
Technical advances in immunostaining and flow cytometry now permit HSCs to be sorted to high purity, yet they remain functionally heterogeneous. The basis for this is unclear and might relate to position within niches, epigenetic status, proliferation history, and/or aging. We now describe CD86 as an extremely useful indicator of heterogeneity among quiescent and otherwise homogenous HSCs. In addition, down-regulation parallels normal progression through nonlymphoid lineages in BM. Re-acquisition of CD86 in mice that received a transplant suggests HSCs may be able to oscillate between states.
We originally discovered CD86− HSCs in mice repeatedly treated with LPS, where a high percentage of proliferating HSCs were also found.9 However, CD86− HSCs naturally appear in healthy adult animals and accumulate with aging, circumstances not associated with abnormal cell cycle activity.35 Regardless of cause or origin, CD86− HSCs have high densities of CD150 and tend to exclude Hoechst dye, properties previously associated with imbalanced differentiation potential.36 Indeed, transplantation of rigorously sorted CD86− HSCs found them to be inferior to CD86+ HSCs in restoring the adaptive immune system. Although they were not robust on transplantation, it should be noted that myeloid-biased HSCs do not necessarily have reduced transplantation potential.7,37,38 Thus, the CD86− HSCs described here appear to be unique.
Normal progression in nonlymphoid lineages paralleled gradual reduction in CD86 densities, and we conclude it is a uniquely valuable differentiation Ag. Selection for marrow cells that are CD86+ enriches for fully competent HSCs, and could substitute for markers such as c-Kit or Sca-1 that are abnormally expressed during fetal life or rebound from myeloablation, induced on nonstem cells during inflammation or usable in only particular strains of mice.2,3 As another example, CD105/endoglin is reported to mark all long-term repopulating HSCs,4,39 but only a fraction of them are CD86+ (T.S., unpublished observations, August 2010). Therefore, selection for cells bearing both molecules should enrich for highly potent HSCs. Quiescence of HSCs generally corresponds to high transplantation efficiency,17 yet that nondividing fraction can be further subdivided according to CD86 expression and competence for lymphopoiesis. Preliminary experiments suggest that this approach will also allow myeloid-biased HSCs to be detected in myeloproliferative diseases (R.I., unpublished findings, July 2011).
There has been debate about initial loss of erythroid/megakaryocytic potential, with recent models predicting that it represents the earliest event in hematopoiesis.19,40 However, this is unlikely to be a stepwise, synchronous process, and individual progenitors may be in the process of losing lymphoid differentiation options. Consequently, we resolved described progenitors27 by flow cytometry and could use CD86 levels to arrange them in a possible differentiation sequence (supplemental Figure 7). Our findings would be consistent with early divergence of progenitors destined to give rise to myeloid and lymphoid cells from all others. As would be predicted by gene expression profiles in previous reports,19,27 megakaryocyte and erythroid progenitors had moderate levels of CD86. Further exploitation of this marker is certain to be informative about the earliest steps in hematopoiesis.
The transition of HSCs to lymphoid progenitors to lymphocytes is marked by gradual changes in cell and cytokine receptors. LMPP/ELPs with high c-Kit and Flt3, but low VCAM-1, can efficiently respond to SCF and FL while giving rise to IL-7Rα+ CLPs.20 CD86 levels remain high over all of those stages, opening the possibility that the progenitors are responsive to CD86 ligands. As precedent, CD86 can transmit signals via p38, PI3K/Akt, and phospholipase C kinase in DCs and B cells.41,42 In that context, it is interesting that regulatory T cells are in close proximity to HSCs in BM and protect them from immune rejection.43 Those lymphocytes and NKT cells are known to express the CD86 ligands CTLA4 and/or CD28.44,45 Mesenchymal stromal cells represent another source for CD28.15 Myelopoiesis is abnormal in mice with deficiencies in T and NKT cells, and B lymphopoiesis is affected in aged CD28 KO mice.15,46 Numbers, staining characteristics, and transplantation potential of HSCs appeared to be normal in CD86 gene-targeted animals. In preliminary experiments, only small changes in hematopoiesis were observed when CD28-Ig or CTLA-4-Ig was added to cultures. However, it remains possible that other B7 family members have overlapping regulatory functions in BM, and CD80 staining is similar to CD86 (R.I., unpublished observations). The 2 molecules can cooperate to regulate early stages of T-lineage lymphocyte development in the thymus.47 Therefore, it will be important to extend these studies with compound KO mice.
As previously shown for DCs, HSC expression of CD86 depends on the transcription factor PU.1.33 In contrast, we found only slight dependence on C/EBPα or C/EBPβ, factors critical for production of nonlymphoid cells. Environmental cues probably dictate CD86 expression, as suggested by the fact that rigorously sorted CD86− HSCs generated CD86+ stem/progenitors when transplanted to lethally irradiated recipients. As another possible example of environment, Notch signals delivered in the thymus can down-regulate PU.1,33 and recent thymus immigrants have little CD86. This contrasts with BM cells that probably replenish the thymus.23 That is, LMPP/ELPs are CD86 bright. Unknown transcription factors must exist that oppose PU.1 induction of CD86 because CD86− myeloid progenitors express PU.1.30 Furthermore, levels of PU.1 do not decline as HSC transition to become lymphoid or myeloid progenitors.48
Lineage biases of HSCs subdivided according to CD86 expression were not absolute, with small numbers of lymphocytes being generated from CD86− HSCs. In addition, CD86 was detectable on stem and lymphoid progenitor cells made by them 6 months after transplantation. This might result from contamination by highly potent CD86+ HSCs that become dominant over time, but our preparations were sorted 3 times to high purity. Furthermore, CD86− HSCs did not re-acquire the marker in short-term cultures (R.I., unpublished observations). The myeloerythroid differentiation potential of a multipotential cell line oscillates in synchrony with Sca-1 levels.49 It is unclear if normal HSCs ever exhibit such behavior, but lymphoid progenitors can reverse differentiation in response to Wnt signaling and be re-directed to an erythroid fate.50 If it occurs, HSC oscillation might be reflected in CD86 expression.
We conclude that CD86 loss delineates subsets of HSCs that are otherwise similar. CD86− HSCs are quiescent but deficient with respect to their ability to restore the adaptive immune system. A marker that does the same for human HSCs might be valuable as an indicator of fitness and suitability for transplantation. It could also serve as a biomarker that reflects early changes in disease.
There is an Inside Blood commentary on this article in this issue.
The online version of this article contains a data supplement.
The publication costs of this article were defrayed in part by page charge payment. Therefore, and solely to indicate this fact, this article is hereby marked “advertisement” in accordance with 18 USC section 1734.
Acknowledgments
The authors thank Karla Garrett for technical assistance, Shelli Wasson for editorial assistance, Jacob Bass and Dr Diana Hamilton for cell sorting, and Beverly Hurt for graphics assistance.
This work was supported by the National Institutes of Health (grants AI020069 and HL107138, P.W.K.; and HL096108, K.L.M.). P.W.K. holds the William H. and Rita Bell Endowed Chair in Biomedical Research.
National Institutes of Health
Authorship
Contribution: T.S. and R.I. designed, performed research, analyzed data and wrote the paper; Q. Z., R.S.W., K.L.M., and J.A.-I. performed research and analyzed data; and P.W.K. designed research, analyzed data, and wrote the paper.
Conflict-of-interest disclosure: The authors declare no competing financial interests.
Correspondence: Paul W. Kincade, Immunobiology and Cancer Program, Oklahoma Medical Research Foundation, Oklahoma City, OK; e-mail: kincade@omrf.org.
References
Author notes
T.S. and R.I. contributed equally to this study.

This feature is available to Subscribers Only
Sign In or Create an Account Close Modal