Abstract
Macrophages are either classically (M1) or alternatively-activated (M2). Whereas this nomenclature was generated from monocyte-derived macrophages treated in vitro with defined cytokine stimuli, the phenotype of in vivo-derived macrophages is less understood. We completed Affymetrix-based transcriptomic analysis of macrophages from the resolution phase of a zymosan-induced peritonitis. Compared with macrophages from hyperinflamed mice possessing a pro-inflammatory nature as well as naive macrophages from the uninflamed peritoneum, resolution-phase macrophages (rM) are similar to monocyte-derived dendritic cells (DCs), being CD209a positive but lacking CD11c. They are enriched for antigen processing/presentation (MHC class II [H2-Eb1, H2-Ab1, H2-Ob, H2-Aa], CD74, CD86), secrete T- and B-lymphocyte chemokines (Xcl1, Ccl5, Cxcl13) as well as factors that enhance macrophage/DC development, and promote DC/T cell synapse formation (Clec2i, Tnfsf4, Clcf1). rM are also enriched for cell cycle/proliferation genes as well as Alox15, Timd4, and Tgfb2, key systems in the termination of leukocyte trafficking and clearance of inflammatory cells. Finally, comparison with in vitro-derived M1/M2 shows that rM are neither classically nor alternatively activated but possess aspects of both definitions consistent with an immune regulatory phenotype. We propose that macrophages in situ cannot be rigidly categorized as they can express many shades of the inflammatory spectrum determined by tissue, stimulus, and phase of inflammation.
Introduction
Macrophages are defined as either pro-inflammatory or anti–inflammatory thereby promoting or dampening innate/adaptive immunity.1 Specifically, macrophages may dispose of necrotic or apoptotic material,2 phagocytose and kill infectious organisms,3 present peptide antigens to lymphocytes,4 and degrade/synthesize components of the extracellular matrix, thereby modulating tissue repair and wound healing.5 In summary, macrophages possess diverse functions as well as a plastic phenotype commensurate with their inflammatory environment. Moreover, macrophages are central to the etiology of many diseases driven by inflammation, including atherosclerosis, rheumatoid arthritis, chronic obstructive pulmonary disease, asthma, and carcinogenesis, for instance. Thus, altering pathogenic macrophages may subvert ongoing inflammatory responses down a resolution/tissue repair pathway.
Macrophages, depending on the microenvironment, may become classically activated (M1) acquiring a pro-inflammatory phenotype or alternatively activated with the latter further subdivided into M2a, M2b, or M2c.6 Regulatory macrophages (M2b), generated in response to immune complexes, have been described,7 which along with M2 cells are immune-suppressive. However, macrophage inflammatory characteristics have largely being garnered from monocytes differentiated in vitro in response to defined stimuli and the phenotype of macrophages in tissues in various phases of the inflammatory response (onset vs resolving; adaptive vs tissue injury) is little understood. Indeed, we suspect, as have others,7 that macrophage plasticity gives rise to a broad range of subtly different phenotypes that may be stimulus, disease, tissue, and phase-of-inflammation specific. Addressing this in the context of self-limiting inflammation, we found previously that macrophages isolated from a resolving peritonitis elicited by yeast cell wall extract (zymosan) possess a hybrid M1/M2.8 Therefore, we aimed to get a more definitive image of macrophages during resolving acute inflammatory responses using Affymetrix-based mRNA transcriptomic analysis. It transpires that macrophage involved in the resolution of acute peritonitis, compared with naive as well as macrophage isolated from septic mice and therefore assumed to have an pro-inflammatory phenotype, are specifically enriched for the biochemical machinery necessary for proliferation as well as antigen processing and presentation, secretion of T- and B-lymphocyte chemokines, and factors that enhance macrophage/dendritic cell (DC) development and promote DC/T-cell synapse formation. Not surprisingly, they also have elevated levels of genes involved in dampening leukocyte trafficking, efferocytosis, and wound repair.
Methods
Reagents
Recombinant mouse cytokines were from Invitrogen (IFN-γ and M-CSF) or PeproTech (IL-4). Lipopolysaccharide (LPS) from Salmonella typhosa was from Sigma-Aldrich. FACS antibodies were from either BD Biosciences (CD11b, CD11c, Ly6c, CD19, MHC class II, CD86, and CD62L) or eBioscience (F4/80 and 7/4 antigen). All chemicals used were from Sigma-Aldrich, unless specified.
Animal maintenance and induction of peritonitis
Male C57Bl6/J were bred in individual ventilated cages and maintained in a 12-hour/12-hour light/dark cycle at 22 ± 1°C and given food and tap water ad libitum in accordance with United Kingdom Home Office regulations. Peritonitis was induced by the intraperitoneal injection of 0.1 or 10 mg/mouse zymosan A. All mouse experiments were approved under a United Kingdom Home Office Project License.
Purification of peritoneal macrophages
Peritoneal cells were obtained by lavage with 3% sodium citrate. On removal from the peritoneum, red blood cells were lysed using ACK lysing buffer (Lonza Walkersville). B cells were removed using anti-CD19 microbeads (Miltenyi Biotec) according to the manufacturer's instructions. Macrophages were further purified by adherence to culture plates in DMEM supplemented with 10% FBS, 2% l-glutamine, and 1% penicillin/streptomycin (all Invitrogen) for 1 hour at 37°C in 5% CO2, after which time, nonadherent cells (T-lymphocytes and neutrophils) were washed off (3 times) using cold sterile PBS (Invitrogen), leaving > 98% macrophage purity (supplemental Figure 1C-D, see the Supplemental Materials link at the top of this article).
Purification of splenic DCs
Isolated murine spleen was injected with 0.5 mL collagenase D (2 mg/mL, Roche Diagnostics) and HEPES (10mM, Invitrogen), cut into smaller pieces and incubated using at 37°C for 30 minutes. Subsequent material was passed through a 70-μm cell strainer (BD Falcon), and collected cells were depleted of red blood cells using ACK lysing buffer. Splenic DCs were then purified using pan DC microbeads (Miltenyi Biotec) according to the manufacturer's instructions. Three subpopulations of splenic DCs (plasmacytoid, CD8α+ and CD8α−) were further purified using flow cytometric cell sorting (see “FACS analysis and cell sorting”).
Generation and activation of BMDMs and BMDCs
Bone marrow-derived macrophages (BMDMs) and bone marrow-derived DCs (BMDCs) were obtained from femurs of 8- to 10-week-old C57Bl6/J. Cells were cultured in DMEM supplemented with 10% FBS, 1% penicillin/streptomycin, 20mM HEPES (all Invitrogen) and recombinant mouse M-CSF (10 ng/mL, BMDM) or GM-CSF (20 ng/mL) and IL-4 (20 ng/mL) for 7 days. Medium including M-CSF or GM-CSF and IL-4 was changed once on day 4. On day 7, live adherent cells were removed from plate using cell dissociation buffer, counted and resuspended in complete DMEM. BMDM were then seeded onto standard 24-well plates and stimulated for 24 hours with both IFN-γ (20 ng/mL) and LPS (100 ng/mL, Salmonella typhosa) or IL-4 (20 ng/mL) for M1 and M2 polarization, respectively. In parallel, unpolarized macrophages were cultured in complete medium alone. BMDCs were seeded onto standard 24-well plates and activated with LPS (100 ng/mL) and 20nM MHC class II-restricted ovalbumin (OVA) peptide (ISQVHAAHAEINEAGR; OVA323–339) for 24 hours.
RNA preparation
Peritoneal macrophages and BMDM were subjected to RNA extraction using RNeasy micro- or mini-kit (QIAGEN) as per the manufacturer's protocol. Contaminating DNA was then removed by DNase I treatment (QIAGEN).
Microarray analysis
RNA quality assessment and microarray analysis were performed at UCL's Wolfson Institute for Biomedical Research, Microarray Facility. Total RNA was quantified using Nanodrop 1000 Spectrophotometer and Agilent Bioanalyser. RNA samples with RNA Integrity Number more than 8.5 were chosen to be prepped for further analysis. Total starting RNA material of 40 ng was prepped using the NuGEN Ovation Pico WTA, and fragmentation and labeling of the SPIA-cDNA were carried out using the NuGEN FL-Ovation Biotin V2. Fragmented and labeled SPIA-cDNA (5 μg) was then hybridized to Affymetrix GeneChip Mouse Genome 430 Version 2.0 Array (as per NuGEN instructions) for 16 hours at 45°C. Arrays were washed and stained using the GeneChip Fluidics Station 450 and scanned using the Affymetrix GeneChip Scanner. Data were normalized using the RMA normalization algorithm in Expression Console 1.1, which was also used to assess quality metrics. Data were submitted to Gene Express (accession number E-MEXP-3189).
Preprocessing, gene expression analysis, and bioinformatics
Sample preprocessing, gene expression analysis, and functional enrichment analysis are described in detail in supplemental Methods.
Gene expression analysis by real-time PCR
Real-time PCR was performed after 500 ng RNA was reverse transcribed (using Mouse Moloney Leukemia Virus reverse transcriptase). A total of 3 ng cDNA was submitted to quantitative real-time PCR (Applied Biosystems 7900HT) with primer pairs listed in supplemental Table 1A-C and quantified using Power SYBR Green (Applied Biosystems) following the manufacturer's instructions. Dissociation curve analysis was performed at 40 cycles to verify the identity of PCR product. For data analysis, the comparative threshold cycle values for constitutively expressed cyclophilin were used to normalize loading variations and are expressed as arbitrary units.
FACS analysis and cell sorting
A total of 400 000 total peritoneal cells resuspended in FACS buffer (5% FBS in PBS) were incubated with antibodies (supplemental Table 2) for 30 minutes in the dark at 4°C. Cells were washed 3 times using wash buffer (1% FBS in PBS). In some instances, cells were then resuspended in 1% FBS in PBS and incubated with streptavidin beads (V500 or PE; BD Biosciences) for 20 minutes in the dark at 4°C. Again, cells were washed 3 times with 1% FBS in PBS and fixed with 0.1% paraformaldyhyde. Control samples were generated using fluorescence minus one controls. In cell sort experiments, monocytes and macrophages were sorted from a population of CD19− cells as either Ly6c+F480+ and Ly6c−F480+. Three distinct populations of splenic DCs were sorted from CD19− and CD3− cells as CD11cintCD45R+, CD11chiCD205−, or CD11chiCD205+. Tests performed after both sorts have shown that these populations are more than 95% pure. All samples were analyzed on a FACS- LSRII or Fortessa or sorted in a FACSAria (both BD Biosciences). Flow cytometry analysis was completed using FlowJo 7.0.1 software (TreeStar).
Statistical analysis of real-time PCR
Results are expressed as mean plus or minus SEM. Differences between results were evaluated by 1-way ANOVA and Bonferroni post-hoc analysis. Differences were considered significant when P < .05. Statistical analysis was performed using GraphPad Prism Version 5 software.
Results
Experimental model
We established 2 separate models of acute inflammation; one triggered by 0.1 mg zymosan resulting in inflammation peaking in severity at 12 hours and resolving thereafter and another triggered by 10 mg zymosan (supplemental Figure 2).8 Inflammation in the latter was maximal at 72 hours and associated with a systemic inflammatory response that persisted for up to 3 weeks as defined by elevated plasma cytokines. Arising from local anti–inflammatory/immunosuppressive cues, we reasoned that macrophages from the resolution phase (48 hours onwards) of inflammation triggered by 0.1 mg zymosan would possess a pro-resolution phenotype (rM), whereas those from the same time frame from 10 mg zymosan would have an M1-like phenotype, hereafter referred to as pro-inflammatory macrophages. We also included macrophages from the naive peritoneum (uninflamed) as well as macrophages from the intermediate time points of the resolving inflammation (0.1 mg zymosan). Thus, resolving and nonresolving inflammation was induced in mice using 2 separate doses of zymosan (0.1 mg and 10 mg) and peritoneal macrophages collected at 5 time points (0, 4, 24, 48, and 72 hours). At each time point, gene expression was measured for 6 biologic replicates using the Affymetrix mouse 430, Version 2.0 arrays.
Differential gene expression analysis
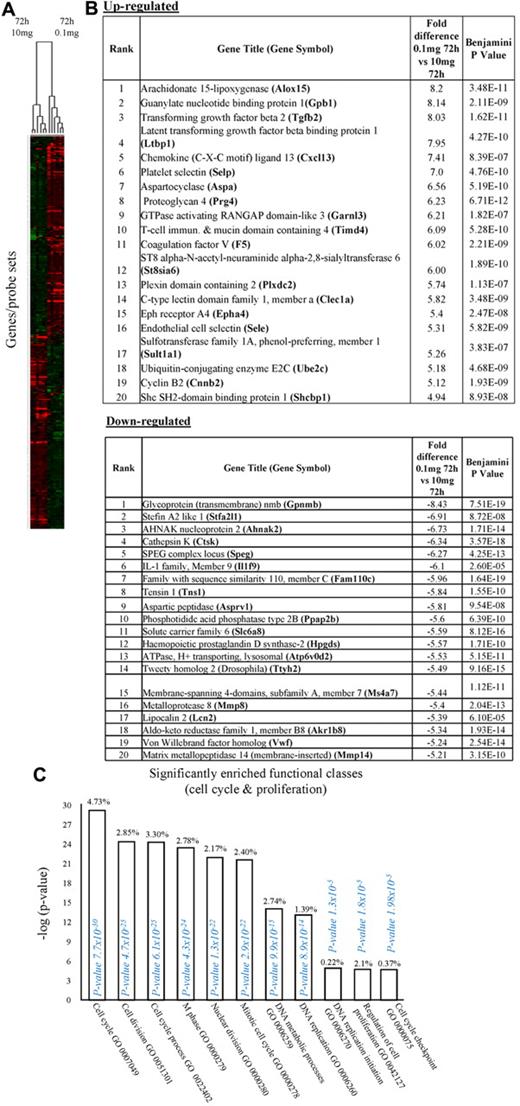
In the first instance, we compared rM against pro-inflammatory macrophages (Figure 1A) using cells from 6 separate animals in each group with gene expression in each showing a clear dichotomy in macrophage phenotypes. Figure 1B reveals a sample of the top 20 most differentially expressed genes in rM cells versus pro-inflammatory macrophages based on false discovery rate (FDR) of 0.001 and fold expression difference of 2. Up-regulated genes include 15-lipoxygenase (Alox15) and T-cell immunoglobulin and mucin domain-containing 4 (Timd4), which are responsible for halting leukocyte trafficking9,10 and the recognition/phagocytosis of apoptotic cells,11 key determinant of resolution. Tgfb2 and latent Tgfb2 along with the T-/B-cell chemoattractant Cxcl13 are also highly expressed in rM compared with inflammatory macrophages as well as cyclin B2 (Ccnb2). We also report a down-regulation of genes associated with inducing inflammation, such as cathepsin K (Ctsk), Il-1 family, member 9 (Il1f9), and metalloprotease 8 (Mmp9) (Figure 1B).
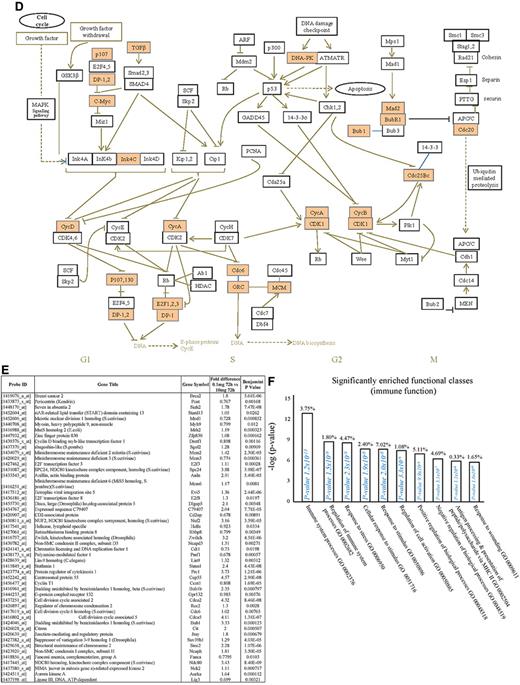
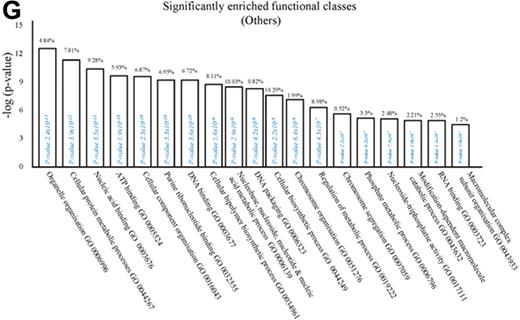
Phenotype of rM compared with pro-inflammatory macrophages. (A) Gene expression of rM is compared with pro-inflammatory macrophages using cells from 6 animals showing a stark contrast in macrophage phenotypes. (B) A sample of the top up- and down-regulated genes in rM cells versus pro-inflammatory macrophages based on FDR of 0.05 and fold expression difference of 1.5. The software package Expander Version 5.1 detected significantly enriched functional gene sets in rM versus pro-inflammatory macrophages, including those for (C) proliferation with key genes enriched for cell cycling shown in panel D and a list of the genes shown in panel E (see Figure 1 continued). The software package Expander Version 5.1 detected significantly enriched functional gene sets in rM versus pro-inflammatory macrophages, including key genes enriched for cell cycling shown in panel D and a list of the genes shown in panel E. In addition to proliferation, other pathways were enriched in rM compared with pro-inflammatory macrophages: (F) immune function. In addition to proliferation, other pathways were enriched in rM compared with pro-inflammatory macrophages: (G) a range of other significantly enriched functional classes.
Phenotype of rM compared with pro-inflammatory macrophages. (A) Gene expression of rM is compared with pro-inflammatory macrophages using cells from 6 animals showing a stark contrast in macrophage phenotypes. (B) A sample of the top up- and down-regulated genes in rM cells versus pro-inflammatory macrophages based on FDR of 0.05 and fold expression difference of 1.5. The software package Expander Version 5.1 detected significantly enriched functional gene sets in rM versus pro-inflammatory macrophages, including those for (C) proliferation with key genes enriched for cell cycling shown in panel D and a list of the genes shown in panel E (see Figure 1 continued). The software package Expander Version 5.1 detected significantly enriched functional gene sets in rM versus pro-inflammatory macrophages, including key genes enriched for cell cycling shown in panel D and a list of the genes shown in panel E. In addition to proliferation, other pathways were enriched in rM compared with pro-inflammatory macrophages: (F) immune function. In addition to proliferation, other pathways were enriched in rM compared with pro-inflammatory macrophages: (G) a range of other significantly enriched functional classes.
We next used the CLICK algorithm on the software package Expander v5.1 to identify significant functional enrichment in genes differentially expressed in rM versus pro-inflammatory macrophages. A 5% false discovery rate and fold change greater than 1.5 revealed 2661 probe sets up-regulated in rM. This analysis found 175 genes involved in proliferation (Figure 1C), including cell cycle (GO:0007049), cell division (GO:0051301), cell cycle processes (GO:0022402), M phase (GO:0000279), nuclear division (GO:0000280), and mitotic cell division (GO:0000278). We entered these 175 genes into DAVID (http://david.abcc.ncifcrf.gov/home.jsp), which revealed significant KEGG pathways presented in Figure 1D and a list of genes from cell cycle class presented in Figure 1E. This proliferative capacity of macrophages is consistent with that published recently.12,13 In these analyses, we also found significant enrichment for immune function (Figure 1F, which will be discussed later) as well a range of other functions that we placed under miscellaneous (Figure 1G). Thus, when comparing rM against pro-inflammatory macrophages, resolution-phase macrophages were significantly enriched for pathways involved in cell proliferation and, to a lesser extent, immune function.
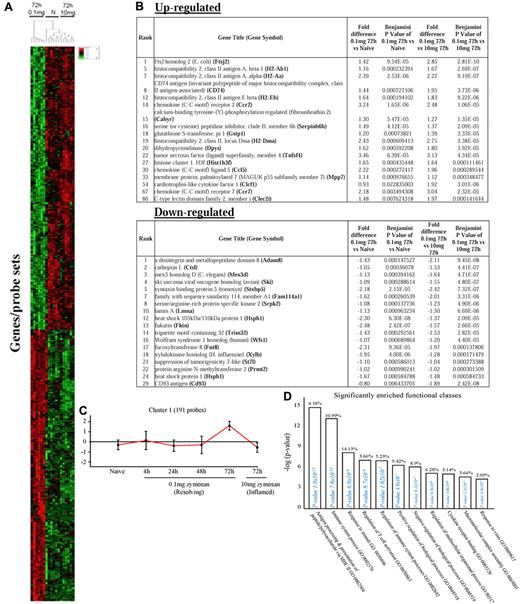
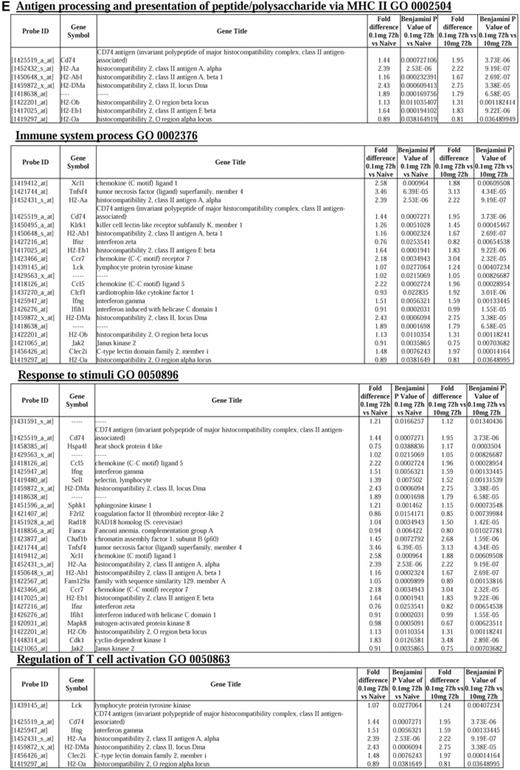
We next asked what genes were differentially expressed in rM but not in inflammatory (10 mg zymosan) or naive macrophages. The objective was to determine whether rM possess a unique phenotype compared with other macrophage populations. In this analysis, an FDR of 0.05 and fold difference of 1.5 revealed 342 genes specifically up- and down-regulated (Figure 2A) in rM with a sample list presented in Figure 2B. Using the CLICK algorithm on Expander to detect significantly enriched functional gene sets for rM versus naive and pro-inflammatory macrophages revealed 4 clusters. Cluster 1 (191 probe sets, Figure 2C) possesses enriched functional datasets that are significantly elevated and exclusive to rM, with genes primarily involved in the regulation of antigen processing and presentation of peptide or polysaccharide antigens via MHC class II (GO:0002504), immune system process (GO:0002376), response to stimuli (GO:0050896), and regulation of T-cell activation (GO:0050863), for instance. Functionally enriched classes are shown in Figure 2D, and a list of these genes is shown in Figure 2E. Thus, from these analyses, we conclude that rM cells possess all the biosynthetic machinery for antigen uptake, processing, and presentation as well as chemoattraction and priming of T/B cells.
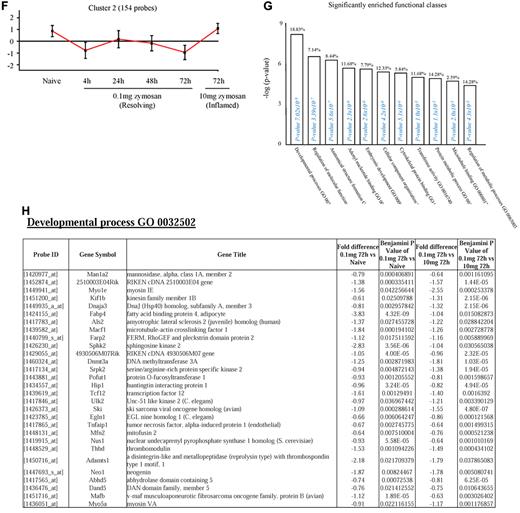
Genes enriched in rM cells compared with naive and pro-inflammatory macrophages. An FDR of 0.05 and fold difference of 1.5 revealed (A) 342 genes up- and down-regulated in rM compared with pro-inflammatory (10 mg zymosan) and naive macrophages, a sample of the most differentially expressed genes presented in panel B. The software package Expander Version 5.1 detected (C) 191 probe sets significantly up-regulated in rM cells with these gene sets enriched for (D) aspect of antigen uptake/presentation and immune function. (E) A list of the genes involved in antigen processing and presentation of peptide/polysaccharide via MHC class II (GO:0002504), immune system process (GO:0002376), response to stimuli (GO:0050896), and regulation of T-cell activation (GO:0050863). There was significant enrichment for (F) 154 down-regulated probe sets with their significantly enriched functional classespresented in panel G. Genes involved in developmental processes (GO:0032502) are listed in panel H.
Genes enriched in rM cells compared with naive and pro-inflammatory macrophages. An FDR of 0.05 and fold difference of 1.5 revealed (A) 342 genes up- and down-regulated in rM compared with pro-inflammatory (10 mg zymosan) and naive macrophages, a sample of the most differentially expressed genes presented in panel B. The software package Expander Version 5.1 detected (C) 191 probe sets significantly up-regulated in rM cells with these gene sets enriched for (D) aspect of antigen uptake/presentation and immune function. (E) A list of the genes involved in antigen processing and presentation of peptide/polysaccharide via MHC class II (GO:0002504), immune system process (GO:0002376), response to stimuli (GO:0050896), and regulation of T-cell activation (GO:0050863). There was significant enrichment for (F) 154 down-regulated probe sets with their significantly enriched functional classespresented in panel G. Genes involved in developmental processes (GO:0032502) are listed in panel H.
Omitting pro-inflammatory macrophage and directly comparing rM with naive macrophages (FDR = 0.05 and fold difference of 1.5) revealed enrichment primarily for immune system process (GO:0002376), antigen processing and presentation of peptide or polysaccharide antigen via MHC class II (GO:0002504), immune response (GO:0006955), and regulation of leukocyte activation (GO:0002694; supplemental Figure 4A-D). From these data, we reasoned that naive tissue macrophages must be enriched for genes that control cell cycling.
In cluster 2 (154 probe sets, Figure 2F), genes were down-regulated in rM compared with inflammatory and naive macrophages. This cluster was enriched for genes involved in developmental processes (GO:0032502), embryonic development (GO:0009790), adenyl nucleotide binding (GO:0030554), and cytoskeletal protein binding (GO:0008092), for instance. A list of genes involved in developmental processes is shown in Figure 2H. Cluster 3 (39 probe sets) and cluster 4 (91 probe sets) represent profiles of genes differentially expressed in rM cells (supplemental Figures 3A-B and C-D, respectively), but not possessing significant biologic functional enrichment.
Further analysis of all 342 genes differentially expressed in the rM cells versus naive and pro-inflammatory macrophages using the MGI GO enrichment tool (VLAD) also identified enrichment of the GO biologic processes antigen presentation (eg, Cd74, H2-Aa, H2-Ab1, H2-DMa, and H2-Eb1), immune system and developmental processes (extensive list in supplemental Table 3), as well as cell activation (eg, Ccl5, Ccr2, Cd74, and Tnfsf4). However, this analysis identified that rMs were also enriched for genes involved in regulation of cell migration (eg, Adam8, Ccl5, Ccr2, Fut8, Plcb1, and Tnfsf4) and apoptosis (eg, Ccl5, Cd74, Gstp1, Prmt2, Ski, Tnfsf4, and Wfs1; Table 1; supplemental Table 3). From these data, we therefore reasoned that naive tissue macrophages must be enriched for genes that control leukocyte differentiation and apoptosis.
Selection of GO terms enriched in the differentially regulated genes in rM versus naive and proinflammatory macrophages identified by VLAD analysis
| GO ID and GO term . | FDR0.001 and fold change > 2.0 (37 genes) . | FDR0.05 and fold change > 1.5 (342 genes) . | |||
|---|---|---|---|---|---|
| P . | k . | P . | k . | M . | |
| GO:0050896: response to stimulus | 1.90 × 10⁻⁶ | 19 | 5.23 × 10⁻¹¹ | 110 | 5836 |
| GO:0007165: signal transduction | NA | NA | 1.35 × 10⁻⁴ | 64 | 3905 |
| GO:0010468: regulation of gene expression | NA | NA | 1.28 × 10⁻¹⁰ | 63 | 2570 |
| GO:0002376: immune system process | 4.19 × 10⁻⁷ | 9 | 1.19 × 10⁻¹⁶ | 43 | 908 |
| GO:0009966: regulation of signal transduction | 2.02 × 10⁻⁴ | 7 | 1.11 × 10⁻⁹ | 37 | 1142 |
| GO:0042981: regulation of apoptosis | 6.31 × 10⁻⁵ | 7 | 1.58 × 10⁻⁹ | 33 | 947 |
| GO:0002682: regulation of immune system process | 2.04 × 10⁻⁷ | 8 | 1.26 × 10⁻¹² | 30 | 594 |
| GO:0010646: regulation of cell communication | 8.45 × 10⁻⁴ | 6 | 5.03 × 10⁻⁶ | 28 | 1042 |
| GO:0035556: intracellular signal transduction | NA | NA | 2.50 | 28 | 1004 |
| GO:0007049: cell cycle | NA | NA | 8.34 × 10⁻⁶ | 23 | 780 |
| GO:0030097: hemopoiesis | 1.79 × 10⁻⁵ | 5 | 4.57 × 10⁻¹⁰ | 19 | 300 |
| GO:0006952: defense response | 1.98 × 10⁻⁵ | 6 | 2.74 × 10⁻⁶ | 19 | 522 |
| GO:0031347: regulation of defense response | NA | NA | 5.80 × 10⁻⁹ | 17 | 276 |
| GO:0007155: cell adhesion | NA | NA | 7.09 × 10⁻⁴ | 16 | 610 |
| GO:0016477: cell migration | 7.10 × 10⁻⁴ | 4 | 9.65 × 10⁻⁶ | 15 | 373 |
| GO:0009611: response to wounding | 8.63 × 10⁻⁴ | 4 | 2.63 × 10⁻⁴ | 13 | 393 |
| GO:0050670: regulation of lymphocyte proliferation | 1.12 × 10⁻⁵ | 4 | 9.35 × 10⁻⁹ | 12 | 127 |
| GO:0034097: response to cytokine stimulus | 3.19 × 10⁻⁶ | 5 | 2.26 × 10⁻⁶ | 12 | 210 |
| GO:0030098: lymphocyte differentiation | 4.05 × 10⁻⁴ | 3 | 1.43 × 10⁻⁷ | 11 | 132 |
| GO:0001817: regulation of cytokine production | NA | NA | 1.05 × 10⁻⁴ | 11 | 263 |
| GO:0042110: T-cell activation | 5.22 × 10⁻⁴ | 3 | 2.81 × 10⁻⁶ | 10 | 144 |
| GO:0045087: innate immune response | 7.10 × 10⁻⁴ | 3 | 7.21 × 10⁻⁶ | 10 | 160 |
| GO:0002819: regulation of adaptive immune response | 5.31 × 10⁻⁸ | 5 | 4.25 × 10⁻⁸ | 10 | 92 |
| GO:0002697: regulation of immune effector process | NA | NA | 9.06 × 10⁻⁵ | 9 | 174 |
| GO:0030335: positive regulation of cell migration | 4.12 × 10⁻⁵ | 4 | 1.03 × 10⁻⁴ | 9 | 177 |
| GO:0019882: antigen processing and presentation | 3.19 × 10⁻⁹ | 5 | 7.23 × 10⁻⁸ | 8 | 53 |
| GO:0045088: regulation of innate immune response | NA | NA | 1.29 × 10⁻⁴ | 8 | 143 |
| GO:0001666: response to hypoxia | NA | NA | 1.07 × 10⁻⁵ | 8 | 101 |
| GO:0009615: response to virus | NA | NA | 1.75 × 10⁻⁵ | 8 | 108 |
| GO:0042113: B-cell activation | NA | NA | 2.60 × 10⁻⁴ | 6 | 85 |
| GO:0002690: positive regulation of leukocyte chemotaxis | 5.27 × 10⁻⁴ | 2 | 2.86 × 10⁻⁴ | 4 | 31 |
k indicates the number of genes in the query set annotated to the GO term, or descendants of the GO term; M, number of genes in the background dataset annotated to the GO term, or descendants of the GO term; and NA, not applicable.
Supplemental Table 3 contains a full list of enriched GO terms and the list of the genes in the query set that are annotated to the GO terms. In this analysis, the regulation GO terms do not have a transitive relationship to the “parent” GO terms, so that there is not a complete overlap between the genes associated with GO:0030335: positive regulation of cell migration and those associated with GO:0016477: cell migration (supplemental Table 3).
Gene ontology and pathway analysis of rMs
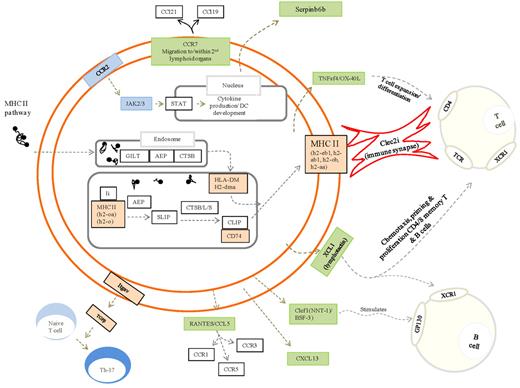
Figure 3 is the author's interpretation of key pathways that define rM based on expression levels (Figures 1B and 2B, up-regulated) and functional enrichment (Figure 2C). Here, pathways significantly expressed in rM cells and central to antigen uptake and processing are highlighted in orange with proteins central to these pathways, but not significantly enriched in rM, presented in white. Green highlights chemokines and their receptors expressed/secreted by rM that trigger T-/B-cell chemoattraction or that facilitates lymphocyte expansion, differentiation, and interaction with T cells.
Unique phenotype of rM. Authors' interpretation of key pathways defining rM are highlighted in color. For example, gold represents those genes central to antigen uptake and processing (all other genes in this pathway are in white and not enriched in rM); and green, chemokines and their receptors expressed/secreted by rM that trigger T-/B-cell chemoattraction or that which facilitate lymphocyte expansion/differentiation or T-cell/rM interaction, such as Clec2i, TNFsf4/OX, and XCL1.
Unique phenotype of rM. Authors' interpretation of key pathways defining rM are highlighted in color. For example, gold represents those genes central to antigen uptake and processing (all other genes in this pathway are in white and not enriched in rM); and green, chemokines and their receptors expressed/secreted by rM that trigger T-/B-cell chemoattraction or that which facilitate lymphocyte expansion/differentiation or T-cell/rM interaction, such as Clec2i, TNFsf4/OX, and XCL1.
PCR validation and comparisons of rM
We next carried out quantitative RT-PCR, which confirmed original microarray findings. For instance, Figure 4A represents genes up-regulated in rM versus pro-inflammatory macrophages. Supplemental Figure 5A through C further validates genes significantly up-regulated in rM versus naive and pro-inflammatory (Figure 5A), whereas Figure 5B and C highlights genes that are suppressed in rM compared with either pro-inflammatory macrophages (Figure 5B) or naive and pro-inflammatory macrophages (Figure 5C). In addition, data from these experiments confirmed the temporal profile of these genes enriched in rM, especially the biphasic expression of these genes in naive and again at resolution (Figure 4). Given the apparent DC-like phenotype deduced in Figure 3, we also included CD209a (monocyte-derived DC marker) in these analyses, which was found to be significantly up-regulated in rM versus pro-inflammatory macrophages using both the microarray analysis (P = .0000167, data not shown) and quantitative RT-PCR (Figure 4B).
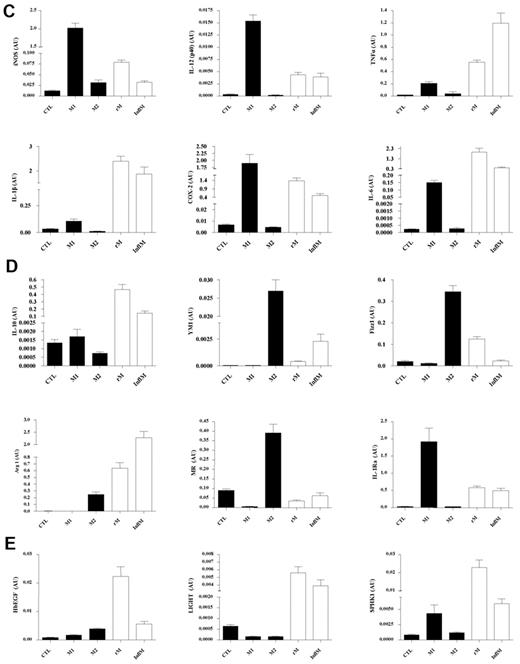
Validation of microarray analyses and phenotype of rM compared with in vitro-derived M1 and M2 macrophages. Quantitative PCR for (A) genes most differentially expressed in rM versus pro-inflammatory macrophages validating original microarray findings, including (B) CD209a, the monocyte-derived DC marker, which was included arising from the DC-like phenotype deduced in Figure 3. For comparisons with established M1/M2 cells, BMDMs were incubated with either LPS/IFN-γ (M1) and/or IL-4 (M2) for 24 hours. RNA was extracted and probed for a range of typical (C) M1, (D) M2, and (E) M2b markers. Data are represented and analyzed by ANOVA followed by Bonferroni multiple comparison tests. Values are mean ± SEM of n = 5 or 6 mice per group. *P < .05, **P < .01, and ***P < .001.
Validation of microarray analyses and phenotype of rM compared with in vitro-derived M1 and M2 macrophages. Quantitative PCR for (A) genes most differentially expressed in rM versus pro-inflammatory macrophages validating original microarray findings, including (B) CD209a, the monocyte-derived DC marker, which was included arising from the DC-like phenotype deduced in Figure 3. For comparisons with established M1/M2 cells, BMDMs were incubated with either LPS/IFN-γ (M1) and/or IL-4 (M2) for 24 hours. RNA was extracted and probed for a range of typical (C) M1, (D) M2, and (E) M2b markers. Data are represented and analyzed by ANOVA followed by Bonferroni multiple comparison tests. Values are mean ± SEM of n = 5 or 6 mice per group. *P < .05, **P < .01, and ***P < .001.
rM compared with conventional in vitro-derived M1 and M2 macrophages
Although we previously found that rM have elevated iNOS and COX 2, markers typical of classically activated M1 cells and thereby suggesting a hybrid phenotype,8 we did not make a direct comparison with in vitro M1/M2. Taking this further, we compared our in vivo-derived rM with in vitro M1 (LPS/IFN-γ) and M2 (IL-4) polarized BMDMs. Here, typical pro-inflammatory markers, such as Nos2 (iNOS), Il12(p40), Tnfa, Il1b, and Ptgs2 (COX 2), are expectedly higher in M1 than M2 BMDMs but are differentially expressed in rM (Figure 4C). Similarly, typical M2 markers, such as mannose receptor, Il10, Ym1, Fizz1, Arg1, mannose receptor (Mr), and Il1ra, although generally higher in alternatively activated macrophages, are also differentially expressed in resolution-phase rM cells (Figure 4D). We also find genes that have been previously shown to be enriched in M2b (regulatory macrophages) polarized using immune complexes (HbEGF, LIGHT, and SPHK1)14 are also significantly up-regulated (Figure 4E). Thus, the results from these experiments prove that rM possess a unique phenotype inconsistent with conventional macrophage nomenclature but most akin to M2b macrophages.
FACS profile of resolving peritonitis
To analyze the temporal profile of monocytes/macrophages throughout resolving inflammation, FACS analysis was conducted using the following markers: Ly6c (monocytes), F4/80 (macrophages) MHC class II, CD86 (antigen presentation/costimulatory marker), CD62L (lost on monocytes as they differentiate), CD11b and 7/4 antigen (Ag) (expressed on activated macrophages but not unstimulated tissue histiocytes). In 2 of the time points (naive and 72-hour 0.1-mg zymosan), we also characterized myeloid derived marker CD115 and C-lectin receptor CD209 (DC-SIGN). Thus, in the naive cavity, Ly6c and F4/80 double labeling revealed 2 categories of monocytes/macrophages (Figure 5A): (i) Ly6c−F480int (∼ 2%) and (ii) Ly6c−F480hi macrophages, the latter composed of approximately 40% of the total population. The remaining 60% of cells in the resting peritoneum are composed of B1a/b, B2, and CD3+ lymphocytes15 and very few CD11c+ DCs (∼ 1% of total cells; supplemental Figure 1C-D). Further characterization reveals that the 2 macrophage populations differ in their size (data not shown) and expression of CD11b, MHC class II, CD86, CD115, and CD209 (Figure 5Ai-ii), which corroborates the findings of others.16
Temporal profile of monocytes and monocyte-derived macrophages during resolving inflammation. (A) Cells from the naive peritoneum were labeled with Ly6c and F4/80, which identified 2 regions (i-ii) by FACS. Each region was further probed for the expression of CD11b, 7/4 antigen, MHC class II, CD86, CD62L, CD11c, CD115, and CD209. A similar approach was used on samples obtained from (B) 24 hours, (C) 48 hours, and (D) 72 hours resolving inflammation as well as (E) inflammation at 72 hours triggered by 10 mg zymosan. Representative figures of 4 replicates are shown from each time point.
Temporal profile of monocytes and monocyte-derived macrophages during resolving inflammation. (A) Cells from the naive peritoneum were labeled with Ly6c and F4/80, which identified 2 regions (i-ii) by FACS. Each region was further probed for the expression of CD11b, 7/4 antigen, MHC class II, CD86, CD62L, CD11c, CD115, and CD209. A similar approach was used on samples obtained from (B) 24 hours, (C) 48 hours, and (D) 72 hours resolving inflammation as well as (E) inflammation at 72 hours triggered by 10 mg zymosan. Representative figures of 4 replicates are shown from each time point.
Ly6chi/F480int and Ly6chi/F480hi monocytes/macrophages were identified at 4 and 12 hours, respectively (supplemental Figure 6A [4h] and B [12h]) with only Ly6chi/F480hi cells expressing MHC class II at 12 hours (supplemental Figure 6B). At 24 hours, Ly6chi/F480hi (Figure 5Bi) and Ly6cint/F480hi (Figure 5Bii) monocytes/macrophages were found with Ly6cint/F480hi cells expressing comparatively higher levels of MHC class II and CD11b. Greater numbers of Ly6cint/F480hi cells also expressed CD62L (Figure 5Bii).
By 48 hours, 3 populations of monocyte/macrophages were identified, including Ly6chi/F480int, Ly6cint/F480int, and Ly6c−/F480hi (Figure 5Ci-iii, respectively) with CD11b and MHC class II expression increasing on cells on their greater acquisition of F4/80. At 72 hours, Ly6chi/F480int and Ly6c−/F480hi cells predominate with the latter mature macrophages expressing higher levels of CD11b, MHC class II, and CD86, CD62L, and CD209; both populations are CD11c− (Figure 5Di-ii). At 72 hours, 10 mg zymosan-inflamed cavity possessed Ly6c+/F480+ and Ly6c−/F480+ monocytes/macrophages that were MHC class IIlow compared with resolution-phase macrophages (Figure 5Ei-ii).
PCR analysis of monocytes/macrophage sorted subpopulation
Flow cytometry identified 2 categories of monocytes/macrophages that variably express F4/80 alone or F480/Ly6c over time. However, initial transcriptomic analysis was carried out on total monocytes/macrophages, and the expression of key genes that defines rM in individual populations is unknown. Therefore, using FACS cell sorting, we isolated Ly6c+F480hi and Ly6c−F480hi cells at 24, 48, and 72 hours during resolving inflammation as well as Ly6c−F480hi macrophages at 72-hour 10 mg zymosan and quantified the expression of a number of genes enriched in rM (taken from Figures 1B and 2) in each population using quantitative RT-PCR (Figure 6). Because each population is proportionally distinct and their population size varies over time, we normalized gene expression to the percentage of each region at the specific time point. The rM specific markers, including Cd86, H2Aa, Ccr2, and Ccl5, obtained from comparing rM against pro-inflammatory and naive macrophages (Figure 2), were highest in the Ly6c−F480hi macrophage population. In addition, many of the markers most elevated in rM compared with pro-inflammatory macrophages, including Alox15, Tgfb2, Cxcl13, and Timd4, were also elevated in Ly6c−F480hi macrophages as was the monocyte-derived DC marker CD209a (Figure 6).
Phenotype of monocyte/macrophage subpopulation throughout resolving inflammation. There are 2 broad categories of monocytes/macrophages, namely, Ly6c+F4/80+ and Ly6c−F4/80hi revealed in Figure 5B through E. These were isolated using FACSAria at 24, 48, and 72 hours from resolving peritonitis as well as at 72 hours from peritonitis triggered by 10 mg zymosan. mRNA was extracted and quantitative PCR carried out for the relative expression of genes enriched in each population. Data are mean ± SEM for n = 3 to 6 replicates per group. Cells from these each of these replicates are pooled from 3 to 5 animals before FACS cell sort.
Phenotype of monocyte/macrophage subpopulation throughout resolving inflammation. There are 2 broad categories of monocytes/macrophages, namely, Ly6c+F4/80+ and Ly6c−F4/80hi revealed in Figure 5B through E. These were isolated using FACSAria at 24, 48, and 72 hours from resolving peritonitis as well as at 72 hours from peritonitis triggered by 10 mg zymosan. mRNA was extracted and quantitative PCR carried out for the relative expression of genes enriched in each population. Data are mean ± SEM for n = 3 to 6 replicates per group. Cells from these each of these replicates are pooled from 3 to 5 animals before FACS cell sort.
Phenotype of rM compared with conventional DCs
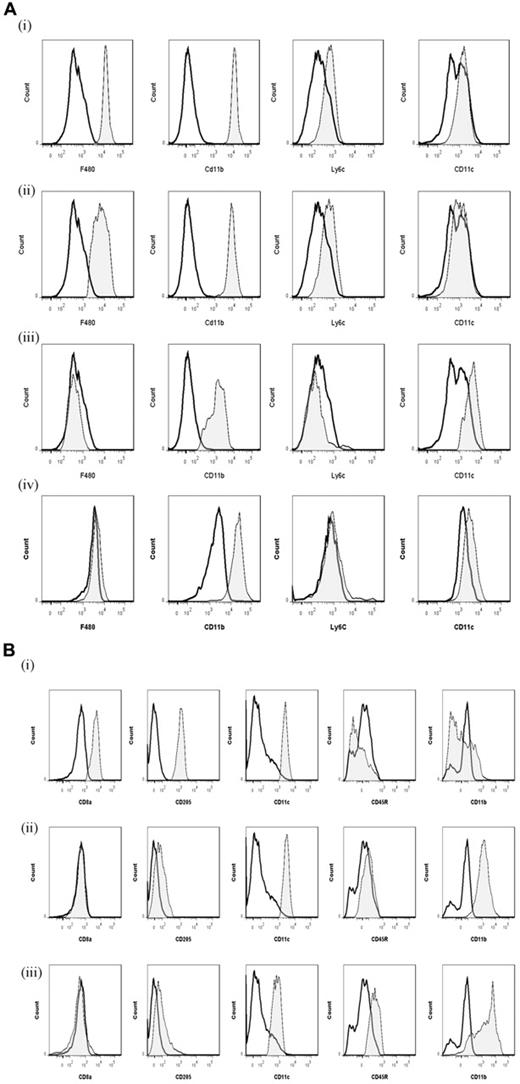
We compared key markers of rM cells to that expressed on splenic plasmacytoid and CD8α+/CD8α− DCs as well as GMCSF/IL-4 generated BMDCs. CD11c was negative on macrophages from the naive peritoneum as well as rM (Figure 7Ai and ii, respectively) but positive on BMDCs (Figure 7Aiv) and expectedly FACS-sorted peritoneal CD11c+ cells. The latter were not from the population of macrophages used for transcriptomic and PCR analysis (supplemental Figure 1D). Furthermore, CD8+, CD8−, and plasmacytoid DCs were characterized as in Figure 7B and along with GM-CSF/IL-4 generated BMDCs were compared with rM at message level. Thus, MHC class II (Figure 5D) as well as costimulatory molecules (CD74 and CD86), monocyte-derived DCs marker (CD209a), and the immune synapse mediator Clec2i are all expressed on rM cells, albeit at variable levels compared with conventional DCs (Figure 7C).
Phenotype of rM compared with conventional DCs. (A) Levels of CD11c expression among other markers were examined on (i) naive peritoneal macrophages and (ii) rM cells compared with (iii) CD11c+ cells-FACS–sorted from a 72-hour resolving peritoneal cavity as well as (iv) GMCSF/IL-4–generated BMDCs stimulated with LPS. (B) We characterized (i) CD8+, (ii) CD8−, and (iii) plasmacytoid DCs for their (C) comparison of with rM at message level for MHC class II as well as costimulatory molecules (CD74 and CD86), monocyte-derived DCs marker (CD209a), and the immune synapse mediator Clec2i among other key rM markers summarized in Figure 3. PerC indicates peritoneal cavity. (B, see previous Figure 7A and B) We characterized (i) CD8+, (ii) CD8−, and (iii) plasmacytoid DCs for their (C) comparison of with rM at message level for MHC class II as well as costimulatory molecules (CD74 and CD86), monocyte-derived DCs marker (CD209a), and the immune synapse mediator Clec2i among other key rM markers summarized in Figure 3. PerC indicates peritoneal cavity.
Phenotype of rM compared with conventional DCs. (A) Levels of CD11c expression among other markers were examined on (i) naive peritoneal macrophages and (ii) rM cells compared with (iii) CD11c+ cells-FACS–sorted from a 72-hour resolving peritoneal cavity as well as (iv) GMCSF/IL-4–generated BMDCs stimulated with LPS. (B) We characterized (i) CD8+, (ii) CD8−, and (iii) plasmacytoid DCs for their (C) comparison of with rM at message level for MHC class II as well as costimulatory molecules (CD74 and CD86), monocyte-derived DCs marker (CD209a), and the immune synapse mediator Clec2i among other key rM markers summarized in Figure 3. PerC indicates peritoneal cavity. (B, see previous Figure 7A and B) We characterized (i) CD8+, (ii) CD8−, and (iii) plasmacytoid DCs for their (C) comparison of with rM at message level for MHC class II as well as costimulatory molecules (CD74 and CD86), monocyte-derived DCs marker (CD209a), and the immune synapse mediator Clec2i among other key rM markers summarized in Figure 3. PerC indicates peritoneal cavity.
Discussion
In this study, we carried out mRNA transcriptomic analysis of macrophages present during the resolution of acute murine peritonitis, revealing a phenotype inconsistent with the conventional M1/M2 nomenclature but possessing aspects of all populations described so far. Uniquely, rM are primarily antigen processing and presenting with the ability to trigger T-/B-cell chemoattraction. rM are also positive for Tgfb2 and Alox15; the latter metabolizes arachidonic (to HETEs and lipoxins),9,10 eicosapentaenoic (to HEPEs and resolvins)17-19 or docosahexaenoic acid (to docosatrienes, protectins, and resolvins).18,20,21 These are fatty acids implicated in anti–inflammatory and pro-resolution processes.22 Also highly expressed in F4/80-positive rM and central to resolution is Timd4, a macrophage receptor that recognizes phosphatidylserine expressed on apoptosing leukocytes.11 This divergence from the established M1/M2 paradigm has been reported elsewhere. For instance, in carbon-tetrachloride induced liver fibrosis, 2 functionally distinct types of macrophages exist: during the injury phase, the predominant macrophage phenotype is closest to that of M2, whereas during recovery from injury, macrophages are more M1-like.23 These authors suggest that the established M1/M2 model inadequately reflects the complex roles of these cells in vivo during liver injury. Indeed, in ischemically injured kidney, proximal tubule cells are proposed to regulate macrophage phenotype.24 Specifically, coculturing proximal tubule cells with BMDMs induce a phenotype that has elevated IL-1β and the macrophage scavenger receptor 1 (Msr1) but low levels of the M2 markers Ym1 or Igf1. However, these hybrid macrophages were associated with renal repair, suggesting again that the M1/M2 paradigm needs readdressing and that macrophage phenotype will vary depending on the tissue as well as the etiology of the inflammatory response.
In the bone marrow, a common monocyte-DC precursor gives rise to monocytes and other precursors termed common DC precursors25 and MHC class II/CD11cint positive pre-cDCs.26 Pre-cDCs move into the blood and, from there, to lymphoid and nonlymphoid tissues forming CD11chi/MHC class IIhi DCs.26,27 Peripheral blood monocytes also differentiate in vitro into DCs (monocyte-derived DCs [Mo-DCs]) in the presence of GM-CSF/IL-4 acquiring dendritic morphology, losing the capacity to phagocytose and adhere to tissue culture surfaces.28,29 Several reports have documented the differentiation of murine CD11c− and MHC class II− blood monocytes into CD11c+MHC class II+ Mo-DCs during various infectious and noninfectious stimuli.30-32 These Mo-DCs present protein antigens to TCR transgenic CD4+ T cells and are distinguished from classic DCs by expression of the monocyte markers Gr-1/Ly6c. More recently, the in vivo differentiation of monocytes to DC-SIGN/CD209a+ Mo-DCs was demonstrated in response to LPS.33 These Mo-DCs lost expression of Gr-1/Ly6c and CD115/c-fms, up-regulated TLR4 and CD14, acquired the probing morphology typical of DCs, localized to the T-cell areas, and through Trif signaling become powerful antigen-capturing and -presenting cells, including cross-presentation of Gram-negative bacteria. In our studies, we report that: (1) rM, but not naive or pro-inflamed, macrophages, are enriched with the biochemical machinery necessary for antigen processing and presentation (eg, MHC class II [H2-Eb1, H2-Ab1, H2-Ob, H2-Aa], CD74, CD86), (2) secrete T- and B-lymphocyte chemokines (eg, Xcl1, Ccl5, and Cxcl13); and (3) secrete factors that enhance macrophage/DC development and promote DC/T-cell synapse formation (eg, Clec2i, Tnfsf4, and Clcf1). We also demonstrate that these cells express high levels of the Mo-DC marker, CD209a. Further FACS analysis of the macrophages during resolution displays 3 subpopulations present within the cavity (Ly6c+F4/80−, Ly6c−F4/80int and Ly6c−F4/80hi) that could contribute to the overall phenotype. We find that the Ly6c−F4/80hi subset, which is composed of approximately 50% resident macrophages originally present in the naive, uninflamed cavity, selectively expresses both MHC class II and CD86 as inflammation resolves. In addition, it is these cells that increasingly express the T- and B-cell chemoattractants, Ccl5 and Cxcl3, and the C-lectin receptor, CD209a. Interestingly, we see a dramatic influx of T (CD3+) and B cells (CD19+) in to the resolving/post-inflamed peritoneum from day 3 onwards (data not shown). It is therefore likely that the role of rM and Ly6c−/F4/80hi, in particular, is in the generation of tissue memory lymphocytes. In addition, given the high levels of CD209a but paucity of CD11c expression on rM, we concur with the finding of others that blood monocytes give rise to a macrophages with hallmarks of a DC in the peritoneum.
There are a series of sequential and often overlapping events collectively required to bring about resolution of acute inflammation and restore homeostasis.34,35 And although this is the prevailing view, data presented in this paper advance our understanding of resolution by suggesting that post-inflamed tissues do not readily revert back to their pre-inflamed/homeostatic state once polymorphonuclear neutrophils disappear (arbitrary definition of inflammatory resolution). Instead, such tissues are populated for a number of weeks with macrophages possessing a unique resolution phenotype described here. Indeed, we argue that the ultimate aim of effective resolution is required to fashion out macrophages that mediate tissue memory. Deviation may result in the generation of more M1-like, nonspecific macrophages as in response to 10 mg zymosan. We are not aware of any other study that has drawn attention to rM as DC-like central players in the generation of tissue memory lymphocytes. And although we are aware that some conventional anti–inflammatory regimens may be resolution toxic as defined by prolonging polymorphonuclear neutrophils numbers,35 we are equally unaware of the impact nonsteroidal anti–inflammatory drugs, steroids, or biologics, for instance, may unwittingly have on this aspect of the resolution cascade. We reiterate that, if the role of rM is to generate tissue memory against further infection/injury, perturbing this process could compromise the host's ability to mount appropriate secondary responses.
In contrast, mice injected with 10 mg zymosan experienced a transient and aggressive, but nonetheless resolving, peritonitis. Isolation of macrophages from the peak of this hyperinflamed state (72 hours) revealed a phenotype that was pro-inflammatory. Further investigations revealed that these macrophages did not acquire an rM phenotype once inflammation abated as defined by clearance of polymorphonuclear neutrophils and cytokines but maintained their distinctly pro-inflammatory state. Although these findings provide an example of where macrophage phenotype remains rigid despite an apparent change in tissue pathology back to homeostasis, we cannot exclude the persistence/absence of a soluble mediator and/or cell type that drives an M1-like state. Thus, understanding the endogenous soluble mediators/cell types that lead to the failed acquisition of a pro-resolution phenotype in such an experimental model may provide opportunities for unraveling the phenotype of nonspecific macrophages that occupy chronically inflamed tissue, such as alveolar macrophage from chronic obstructive pulmonary disease patients.
In conclusion, carrying out a full transcriptomic analysis of resolution-phase macrophage has revealed that these cells are enriched with the capacity to proliferate, secrete T-/B-cell chemoattractants, present antigens, as well as carry out more conventional aspects of resolution arising from the expression of Alox15 and its generation of pro-resolution lipoxins as well as Timd4, which is important in the phagocytosis of apoptotic cells. This repertoire of genes that control these diverse processes do not readily fall into the M1/M2 classification of macrophage phenotype but are more regulatory and modulatory in nature.
This article contains a data supplement.
The publication costs of this article were defrayed in part by page charge payment. Therefore, and solely to indicate this fact, this article is hereby marked “advertisement” in accordance with 18 USC section 1734.
Acknowledgments
The authors thank Mr Dominic Sparkes who assisted M.J.S. with some experimentation.
D.W.G. is a Wellcome Trust–funded senior research fellow. M.J.S. is a recipient of a Medical Research Council/GlaxoSmithKline–funded fellowship.
Wellcome Trust
Authorship
Contribution: D.W.G. and M.J.S. designed and carried out the research and wrote the paper; J.N. and J.B. contributed to the research and wrote the paper; S.S. carried out bioinformatics; E.B.C. and R.C.L. carried out gene ontology studies; S.F. supplied essential experimental tools; and D.W.G., M.J.S., and S.S. analyzed data.
Conflict-of-interest disclosure: The authors declare no competing financial interests.
Correspondence: Derek W. Gilroy, Centre for Clinical Pharmacology and Therapeutics, Division of Medicine, 5 University St, University College London, London, WC1E 6JJ, United Kingdom; e-mail d.gilroy@ucl.ac.uk.





This feature is available to Subscribers Only
Sign In or Create an Account Close Modal