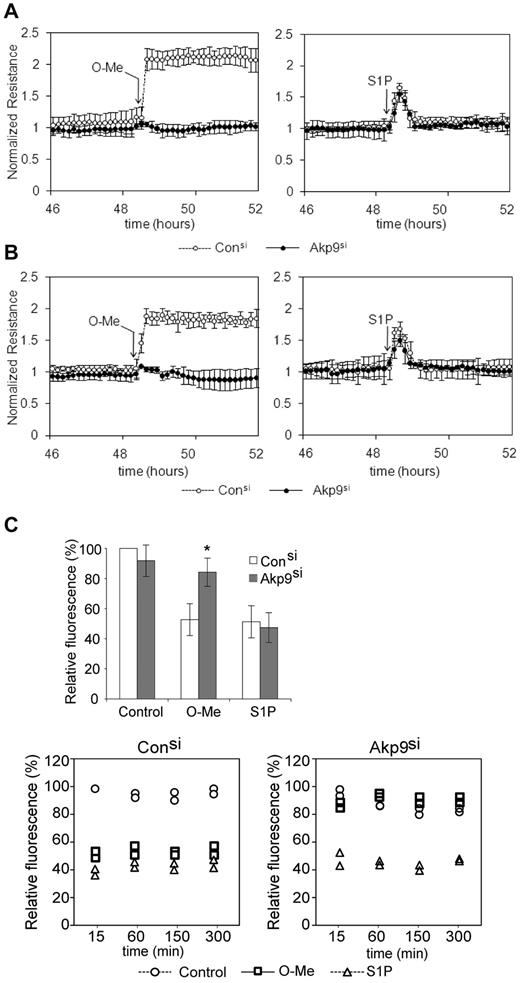
On page 712 of the 13 January 2011 issue, the data from independent experiments used to plot histograms in Figure 3A and B were incorrectly compiled and therefore contained errors. The original data have been re-plotted and, although the correction results in a change in individual data points plotted, the profile of the histograms remains the same as those in Figure 3 of the parent article. Thus, the results of Figure 3 and conclusions stated in the original article remain unchanged. The legend for the corrected figure is as published in the parent article. The corrected figure is shown.
AKAP9-depleted cells display defects in Epac-induced enhancement of barrier properties. (A) TER of AKAP9 (Akp9si) and control (Consi) siRNA-treated HUVEC monolayers at baseline and following the addition of O-Me-cAMP (left panel) or S1P (right panel) at the times indicated by arrows. N = 5 experiments. (B) TER in HDMECs in response to indicated agonists. N = 3 experiments. In panels A and B, TER measurement was normalized to the resistance of the sample at time 0, which was taken 10 minutes following the addition of siRNA duplexes. Data points are average ± SD. TER data points at 45 hours and greater reflect the effects of AKAP9 silencing on resistance. AKAP9 silencing did not significantly affect basal permeability in HUVECs (A) or HDMECs (B). However, AKAP9-silenced cells fail to respond to O-Me-cAMP. (C) Top panel, dextran leakage across control siRNA and AKAP9 siRNA cell monolayers after 15 minutes of treatment with vehicle control, O-Me, or S1P (n = 3). Bottom panels, time course of dextran leakage in control (left) and AKAP9-silenced (right) cells following agonist treatment for the indicated times in minutes. One of 2 representative experiments is shown; the data represent 2 determinations (in duplicate wells) at each time point. Results are reported as a percentage of the value obtained with control siRNA at the 15-minute time point, which was set at 100%. *P < .05.
AKAP9-depleted cells display defects in Epac-induced enhancement of barrier properties. (A) TER of AKAP9 (Akp9si) and control (Consi) siRNA-treated HUVEC monolayers at baseline and following the addition of O-Me-cAMP (left panel) or S1P (right panel) at the times indicated by arrows. N = 5 experiments. (B) TER in HDMECs in response to indicated agonists. N = 3 experiments. In panels A and B, TER measurement was normalized to the resistance of the sample at time 0, which was taken 10 minutes following the addition of siRNA duplexes. Data points are average ± SD. TER data points at 45 hours and greater reflect the effects of AKAP9 silencing on resistance. AKAP9 silencing did not significantly affect basal permeability in HUVECs (A) or HDMECs (B). However, AKAP9-silenced cells fail to respond to O-Me-cAMP. (C) Top panel, dextran leakage across control siRNA and AKAP9 siRNA cell monolayers after 15 minutes of treatment with vehicle control, O-Me, or S1P (n = 3). Bottom panels, time course of dextran leakage in control (left) and AKAP9-silenced (right) cells following agonist treatment for the indicated times in minutes. One of 2 representative experiments is shown; the data represent 2 determinations (in duplicate wells) at each time point. Results are reported as a percentage of the value obtained with control siRNA at the 15-minute time point, which was set at 100%. *P < .05.


This feature is available to Subscribers Only
Sign In or Create an Account Close Modal