

Abstract
Abstract 5301
The gradient echo multiecho T2* Magnetic Resonance Imaging (MRI) technique is the most robust method for sensitive and reproducible quantification of iron overload in transfusion dependent patients. The 1.5T MRI scanners are generally used in the clinical arena, but 3T scanners are becoming largely widespread. So, this study aimed to determine the feasibility, reproducibility and reliability of the multiecho T2* approach at 3T for myocardial and liver iron burden quantification and the relationship between T2* values at 3T and 1.5T.
38 transfusion-dependent patients underwent MRI for T2* assessment at 1.5T and 3T. Twenty healthy subjects were studied at 3T to determine the normal cut off for the T2* values at 3T. For the heart segmental and global T2* values were calculated after developing a correction map to compensate the artefactual T2* variations at 3T. In the liver the T2* value was determined over a circular region of interest.
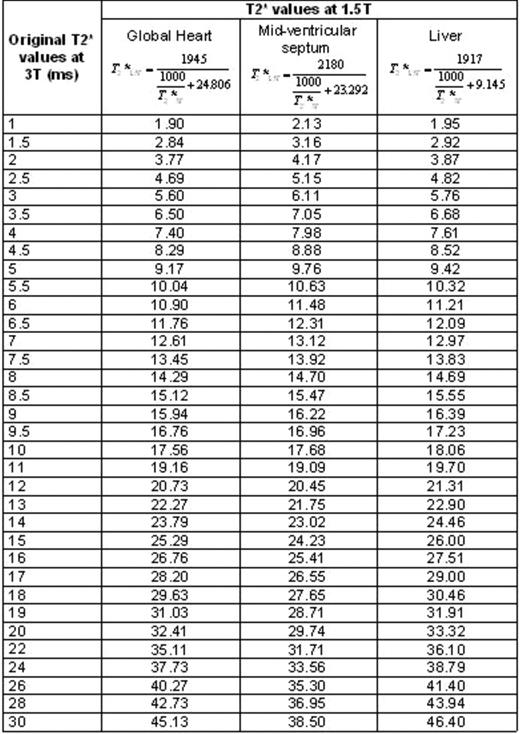
The intra- and inter-operator reproducibility for T2* measurements at 3T was good (ICC>0.949). Segmental correction factors were significantly higher at 3T vs 1.5T (P=0.002). A strong linear relationship was found between patients' R2* values at 3T and 1.5T. For both liver and heart, the R2* values at 3T were about twice that at 1.5 T with an intercept depending on the non-iron component of the tissue. The concordance between global and mid-ventricular septum values confirmed the consistence of measurements. A conversion formula returning the T2* values at 1.5T from T2* values at 3T was proposed for clinical use (Table 1). At 3T we found a full diagnostic reliability to evaluate myocardial iron burden in the mid-ventricular septum (sensitivity, specificity and accuracy 100%), reflecting the non significant difference in the susceptibility artefacts in this region at 1.5T and at 3T. Also for the global heart T2* value the diagnostic reliability was high after the application of an appropriate correction procedure (sensitivity 100%, specificity and accuracy 97%). For the segmental measurement of iron levels at 3T, the accuracy was no optimal, reflecting the significant difference in the susceptibility artefacts at 1.5T and at 3T. The accuracy was high to identify patients with mild to no liver iron burden (97%) but dropped to 94% in the identification of patients with heavy- moderate liver iron burden. The sensitivity was unsatisfactory (67%) to detect patients with heavy liver iron burden. Lower limits of normal for T2* values at 3T were 23.3 ms, 21.1 ms 11.7 ms, for the global heart, mid-ventricular septum and liver, respectively.
T2* values at 1.5T evaluated starting by the T2* at 3.0T. For each district (global heart, mid-ventricular septum and liver), the equation with the corresponding values used for the slope and the intercept is indicated.
T2* quantification of iron burden in the mid-ventricular septum, global heart and no heavy-moderate livers resulted to be feasible, reproducible and reliable at 3T. Challenge was the segmental heart T2* analysis due to significantly higher susceptibility artefacts at 3T.
No relevant conflicts of interest to declare.

This feature is available to Subscribers Only
Sign In or Create an Account Close Modal