

Abstract
Abstract 5261
An increase in mean platelet volume (MPV) is correlated with platelet activation and subsequent shape change. Pathologic processes marked by increased platelet activity such as myocardial infarction, cerebral vascular accidents, diabetes mellitus, and hypertension are associated with an increased MPV. Elevated MPV in these conditions reflect both a higher level of platelet activation as well as increased platelet turnover secondary to platelet consumption within thrombus formation. Assessment of MPV can be used to risk stratify patients as well as assign them to prognostic categories. However, MPV does not assess platelet heterogeneity or the specific change in single platelet mass, volume, or density. Current methods provide little insight into changes in physical parameters at the single platelet level. In order to overcome this limitation, we developed a quantitative tomographic differential interference contrast (QTDIC) microscopy technique to measure dry mass, volume, and density of platelets at the single-cell level. This technique is based on determining the axially resolved refractive index from a series of through-focus DIC images. Single cell platelet mass was observed to reduce from 1.84 ± 0.14 pg to 1.60 ± 0.13 pg in response to stimulation with thrombin-receptor agonist peptide (TRAP), while single cell platelet volume reduced from 7.28 ± 0.56 fL to 6.03 ± 0.48 fL (mean ± SEM). Single cell platelet density increased from 0.25 ± 0.001 pg/fL to 0.26 ± 0.002 pg/fL (mean ± SEM). Taken together, we have characterized the physical parameters of platelets in response to agonist stimulation. Our data suggest that platelet activation may correlate with decreased mass and volume, perhaps as a consequence of platelet degranulation. Further elucidation of the morphological changes of activated platelets at the single platelet level may allow for better understanding of platelet function and dysfunction in patients affected by platelet granule deficiencies, giant platelet syndromes, and disorders associated with membrane receptors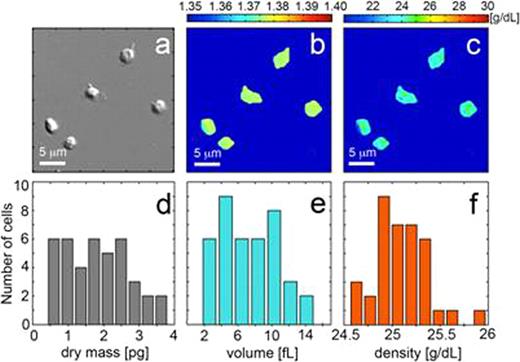 Close modal
Figure 1.

Characterization of physical parameters of platelets. (a) DIC image of human platelets, (b) refractive index map, (c) dry mass density map determined from refractive index using the Barer calibration, (d) Histogram of platelet dry mass, (e) Histogram of platelet volume, (f) Histogram of platelet density.
Figure 1.
Characterization of physical parameters of platelets. (a) DIC image of human platelets, (b) refractive index map, (c) dry mass density map determined from refractive index using the Barer calibration, (d) Histogram of platelet dry mass, (e) Histogram of platelet volume, (f) Histogram of platelet density.
Disclosures:
No relevant conflicts of interest to declare.

This feature is available to Subscribers Only
Sign In or Create an Account Close Modal