Abstract
Abstract 499
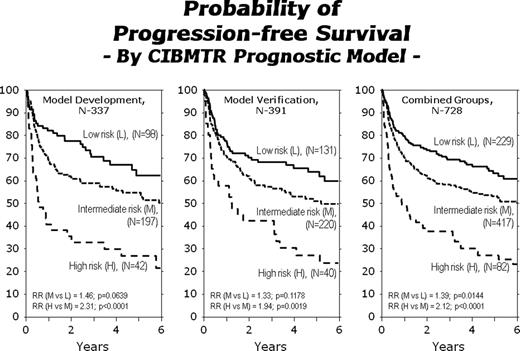
AHCT is standard therapy for relapsed or refractory HL. Published prognostic models for HL patients based on factors measured at the time of AHCT have been limited by small sample sizes. HL prognostic models based on information from diagnosis may be difficult to use for AHCT outcomes since diagnostic information is often not available to the tertiary transplant center or the tests were not uniformly performed by multiple referring physicians. Our goal was to develop a new prognostic model for PFS post-AHCT based on factors available at time of AHCT. We analyzed a cohort of 728 relapsed or refractory HL patients receiving an AHCT between 1996–2007, reported to the CIBMTR by 162 centers, who had complete data for all significant factors previously reported in prognostic models. Patient characteristics at diagnosis: 40% male, 52% stage III-IV, 57% B symptoms, 34% extranodal disease. Patient characteristics at AHCT: median (range) age 33 (7–74) years; 74% KPS≥90 pre-AHCT; 40% had ≥3 prior chemotherapy regimens; 36% chemo-sensitive relapse 27% CR2, 19% PR1, 12% chemo-resistant relapse, 6% primary refractory/resistant; median (range) time from diagnosis to AHCT 22 (3–368) months. Histologic types were: 74% nodular sclerosis, 14% mixed cellularity, 7% lymphocyte rich, 1% lymphocyte depleted, 4% other/unknown. High dose therapy regimens were primarily BEAM (71%) or CBV (13%). For the entire cohort, 3-year estimates of PFS and OS were 60% and 73%, respectively. Multivariate models for treatment failure (1-PFS) were built using a forward step-wise procedure with p<0.05 to enter the model. The following variables were considered: number of prior chemotherapy regimens; KPS; histology; B symptoms at diagnosis; disease status at AHCT; chemo-sensitivity at AHCT; serum LDH at AHCT; extranodal involvement any time prior to AHCT; size of largest mass prior to AHCT; time from diagnosis to AHCT. A random subset of patients was used for model development (n=337) and the model was validated in the remaining cases (n= 391). The final model is shown in the Table
| Risk Factor . | RR (95% CI) . | P . | Score . |
|---|---|---|---|
| # of prior chemotherapy regimens: (3,4,5) vs (0,1,2) | 1.80 (1.31–2.47) | 0.0003 | 2 |
| Extranodal involvement any time prior to AHCT: Yes vs No | 1.77 (1.24–2.53) | 0.0018 | 2 |
| KPS prior to AHCT: 0–80% vs 90–100% | 1.47 (1.04–2.07) | 0.0275 | 1 |
| HL chemo-sensitivity at AHCT: Resistant vs Sensitive | 1.45 (1.01–2.07) | 0.0440 | 1 |
Hahn:Novartis: stock. Montoto:Genentech: Research Funding; Roche: Honoraria.
Author notes
Asterisk with author names denotes non-ASH members.


This feature is available to Subscribers Only
Sign In or Create an Account Close Modal