Abstract
Abstract 3915
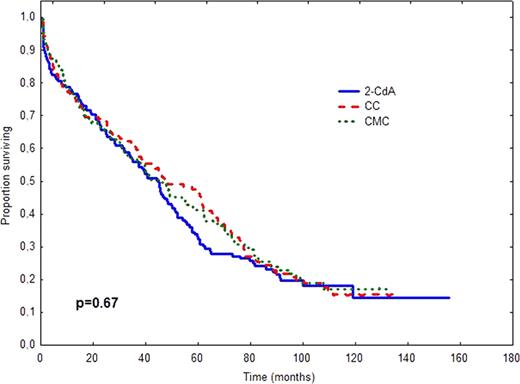
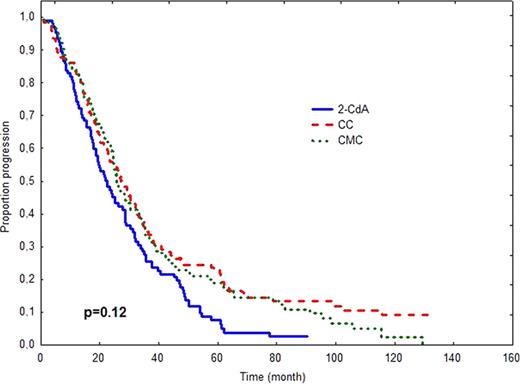
In 2006 we have published an early report of the prospective, randomized, multicenter study (PALG CLL2) comparing the efficacy and toxicity of cladribine alone and in combination with cyclophosphamide (CC) or cyclophosphamide plus mitoxantrone (CMC) in 508 previously untreated patients with progressive and advanced CLL (Blood. 2006;108:473–9). In this early analysis we found that CMC induced higher CR rate than CC (36% vs. 21%, p=0.004), but no differences in overall response (OR), progression-free survival (PFS) and overall survival (OS) among treatment groups were observed. The aim of the present study was to verify whether long-term follow-up might change originally published data on PFS or/and OS as well as to compare the rate of late complications including secondary neoplasms and Richter's syndrome. Methods. In PALG CLL2 study PFS was defined as the time from the end of first–line therapy to disease progression or death from any cause. OS was measured from the time of randomization to death or last contact. OS and PFS were calculated according to the method of Kaplan and Meier and compared between groups by the log-rank test. Only patients with pathologically-proven tumours diagnosed after chemotherapy initiation were considered as having secondary neoplasms or Richter's syndrome. Frequencies of secondary tumours were compared by chi2 test. Results. The median time of follow-up as of Januar y 2011 was 45.6 months (95% CI: 39.9–51.4). The results of comparison of survival times and late complications in different study arms are shown in Table 1 and Figure 1. Conclusions. Long term results for 508 r andomized patients confirm that cladribine alone, CC and CMC regimens produce comparable PFS and OS in previously untreated progressive CLL. The risk of secondary tumours does not differ in the investigated treatment groups.
| Characteristics . | 2-CdA . | CC . | CMC . | P . |
|---|---|---|---|---|
| N | 165 | 167 | 162 | |
| Died, N (%) | 120 (72.7) | 122 (73.1) | 112 (69.1) | |
| N re-treated | 11 | 11 | 17 | 0.56 |
| N subsequent treatments (median, range) | 2 (1–6) | 2 (1–5) | 2 (1–6) | 0.7 |
| Median PFS, months (95% CI) | 22.4 (17.6–27.2) | 27.2 (22.0–32.3) | 25.6 (22.2–28.1) | 0.12 |
| Median OS months (95% CI) | 45.1 (37.8–52.3) | 47.7 (32.1–63.3) | 45.6 (33.2–58.1) | 0.67 |
| Richter syndrome | 2 | 5 | 4 | 0.65 |
| Secondary epithelial neoplams | 7 | 15 | 9 | 0.17 |
OS (A) and PFS (B) after treatment with 2-CdA, CC or CMC.
No relevant conflicts of interest to declare.
Author notes
Asterisk with author names denotes non-ASH members.


This feature is available to Subscribers Only
Sign In or Create an Account Close Modal