Abstract
Abstract 3563
The distinctive features of the World Health organization (WHO) classification compared to French-America-British Co-operative group (FAB) classification of acute myeloid leukemia is the new morphological entity “AML with multilineage dysplasia (MLD)”, and now this subgroup has been renamed as 'AML with myelodysplasia-related change (MRC)”. It generally accepted that dysplasia was most frequently noted in older individual, is often associated with an unfavorable cytogenetic profiles and unfavourable response to therapy. However it is still controversial. Therefore, we evaluated the impact of MRC on overall survival (OS) and leukemia free survival (LFS) in acute myeloid leukemia patients.
A total of 644 adult AML patients diagnosed at Samsung Medical Center (SMC) between Sep.1994 and Oct. 2010 were enrolled. We reviewed their medical histories, clinical parameters, hemogram data, bone marrow aspirate and cytogenetic studies, and reclassified them into AML with of MRC and without MRC groups. Of 664 patients, 543 patients were received induction chemotherapy, among them, 84 patients demonstrated MRC and 451 patients did not. Median age was 50 (15–88) years old, and 57.1% of patients were male. Median follow up period was 77.3 [0–191] months.
AML without MRC group had more favorable cytogenetic risk, higher WBC counts and LDH levels than those with MRC. However, other variable such as age, sex, hemoglobin level, absolute neutrophil, and peripheral blast count, induction chemotherapy regimen, hematopoietic stem cell transplantation, CR1 (complete response after induction chemotherapy), CRp (complete recovery of platelet), and relapse rate were not different between two groups. Since FLT3-ITD and NPM1 tests were introduced into laboratory work after 2005, results of these tests were available only in 158 and 75 patients respectively, and these were not different between two groups.
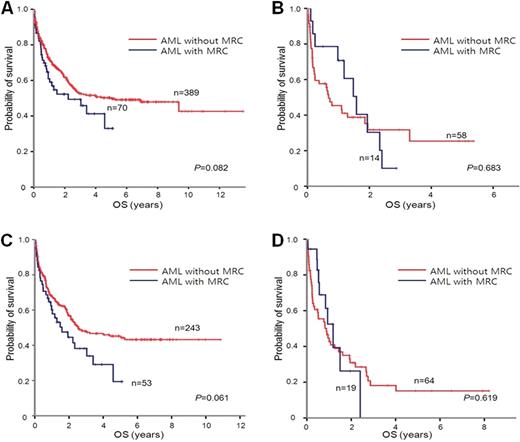
In univariate analysis, advanced age (>65 years) predicted worse LFS (median LFS [95% C.I.]; ° Â65 years vs >65 years; 9.3[7.2–11.4] vs 5.9[4.6–7.2] months, p =0.014). In terms of OS, young age (p=0.000), female (p=0.000), favorable cytogenetic risk (p=0.000), CR1 (p=0.000), CRp (p=0.000), absence of relapse (p=0.000), and HSCT (p=0.000) showed a higher probability of longer OS (Table 1). The presence of MRC, FLT3-ITD, and NPM1 did not affect OS (Table 1).
Summary of univariate analysis for overall survival.
| . | . | Median OS (months) [95% C.I.] or mean OS ± SD (months) . | p . |
|---|---|---|---|
| Age | °Â65 years | 47.9 [17.1 – 78.6] | 0.000 |
| >65 years | 13.1 [5.9 – 20.4] | ||
| Sex | Male | 23.2 [16.5 – 30.0] | 0.000 |
| ¢Female | 112.2 [ – ] | ||
| Cytogenetic risk | ¢Favorable | 107.0±7.4 | 0.000 |
| Intermediate | 28.0 [19.0 – 36.9] | ||
| Unfavorable | 10.8 [7.8 – 13.7] | ||
| Unknown | 17.5 [6.8 – 28.1] | ||
| MRC | Absence | 35.9 [6.6 – 65.2] | 0.081 |
| Presence | 19.0 [6.9 – 31.0] | ||
| CR1 | ¢Yes | 112.2 [–] | 0.000 |
| No | 3.6 [1.1 – 6.1] | ||
| CRp | ¢Yes | 70.9±4.4 | 0.000 |
| No | 54.8 [18.5 – 91.1] | ||
| Relapse | Yes | 21.5 [17.2 – 25.9] | 0.000 |
| No | 17.5 [–] | ||
| HSCT | ¢Auto | 86.2±5.6 | 0.000 |
| ¢Allo | 83.8±6.5 | ||
| Not done | 17.5 [10.8 – 24.1] | ||
| FLT3-ITD | Positive | 8.2 [0–26.1] | 0.595 |
| Negative | 29.5 [20.9–38] | ||
| NPM1 | ¢Positive | 104.1±11.0 | 0.978 |
| ¢Negative | 78.9±15.0 |
“median survival not reached
Overall survival (OS) according to the presence of MRC in age ° Â65 group (A), age>65 group (B), intermediate cytogenetic risk group (C)), and unfavorable cytogenetic risk group (D).
Overall survival (OS) according to the presence of MRC in age ° Â65 group (A), age>65 group (B), intermediate cytogenetic risk group (C)), and unfavorable cytogenetic risk group (D).
In this study, patients with MRC did not show inferior outcomes than those without MRC. Therefore it is not necessary to decide different treatment strategy according to the presence of MRC
No relevant conflicts of interest to declare.
Author notes
Asterisk with author names denotes non-ASH members.


This feature is available to Subscribers Only
Sign In or Create an Account Close Modal