Abstract
Abstract 3144
Among randomized controlled trials (RCTs) of MM, there are a number of different competing treatment regimens. These treatment regimens create a treatment network. To determine which of these regimens are superior, these treatments are tested in RCTs. The way in which researchers choose which regimen to study is often unclear. Furthermore, it is typically uncertain how particular RCTs relate to the overall network of all existing treatment comparisons. For researchers who are designing new trials and for the medical community at large, it would be important to evaluate each trial in the context of the entire research network. SNA provides the appropriate tools that can give a “bird's-eye view” of the overall treatment network. SNA enables us to examine the relationships, directions and importance of patterns among different treatment regimens which gives us insights into the processes of research development. Here, we focus on SNA of RCTs of autologous stem cell transplant (ASCT) and novel agents for MM.
All trials studying the novel agents of thalidomide, lenalidomide, bortezomib or ASCT among patients with MM were eligible for our analysis. Medline (PubMed) and Cochrane database of RCTs were searched through July 2011 to identify potentially relevant phase III RCTs. Abstracts from the annual proceedings of the American Society of Hematology and American Society for Clinical Oncology were also searched. Data on treatments used for experimental and standard arm were extracted. SNA analysis included calculation of the following measures: betweenness, density, clustering coefficient, closeness, degree, Girvan-Newman Algorithm, maximum geodesic distance and distance among selected treatments. Data were analyzed with UCINET 6 and figures were created with NetDraw 2.110.
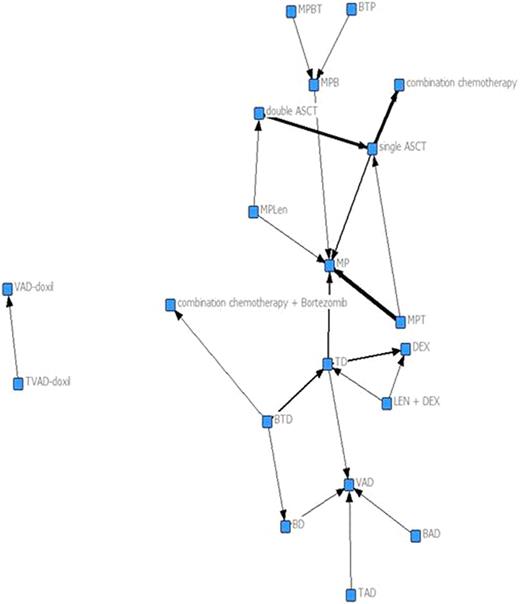
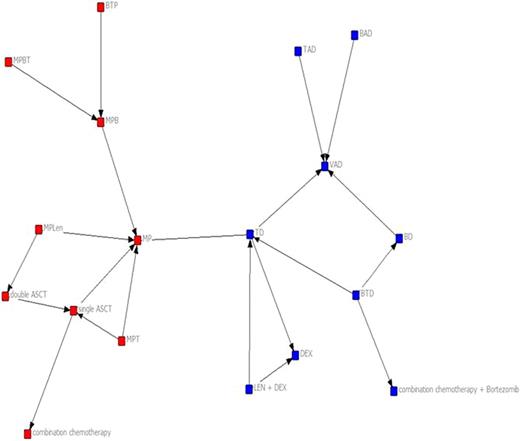
Thirty-eight RCTs enrolling a total of 12, 820 patients were included. The complete network is shown in Figure 1. The density of the network was low (Table) indicating there is little cohesion among the treatments studied. This suggests there is little overall communication between various researchers in the field. Additionally, network betweenness was low signifying that no single treatment is central to the network. While the maximum geodesic distance was equal to three, indicating that all connected treatments could reach each other in three “steps” within the same pathway of development, the distance between many important treatments was undefined. This demonstrates that many research development endeavors occur separately and in isolation with no connection to other pathways of research development leaving important treatment combinations untested. This is further supported by the Girvan-Newman Algorithm (Figure 2) which shows that without the comparisons of thalidomide-dexamethasone (TD) and melphalan-prednisone (MP) the network would be completely disconnected.
Our findings show that research programs in myeloma, which is a relatively small field, are surprisingly decentralized with a lack of connectivity among various research pathways. The result of this is a lack of head-to-head RCTs of novel agents compared to each other or single ASCT as demonstrated by the low betweenness and the undefined distances between these treatments. Using SNA to visually and analytically examine treatment networks prior to designing a clinical trial can lead to better designed studies addressing more relevant research questions.
Myeloma Treatment Network. The line thickness indicates the number of times two treatments were compared.
Myeloma Treatment Network. The line thickness indicates the number of times two treatments were compared.
Metrics for Myeloma Treatment Network
| Measure . | Value . |
|---|---|
| Average Density (%) | 13.07 |
| Maximum geodesic distance | 3 |
| Network Betweenness (%) | 1.47 |
| Clustering Coefficient (%) | 26.5 |
| in-Closeness (%) | 12.09 |
| out-Closeness (%) | 4.32 |
| in-Degree (%) | 9.59 |
| out-Degree (%) | 5.14 |
| Distance from: | |
| MPT1 to combination chemotherapy | 2 |
| MPB2 to combination chemotherapy | undefined |
| MPLen3 to combination chemotherapy | 3 |
| MPT to MPB | undefined |
| MPT to MPLen | undefined |
| MPB to MPLen | undefined |
| MPT to single ASCT | 1 |
| MPB to single ASCT | undefined |
| MPLen to single ASCT | 2 |
MPT=melphalan-prednisone-thalidomide
MPB=melphalan-prednisone-bortezomib
MPLen=melphalan-prednisone-lenalidomide
No relevant conflicts of interest to declare.
Author notes
Asterisk with author names denotes non-ASH members.


This feature is available to Subscribers Only
Sign In or Create an Account Close Modal