Abstract
Abstract 2789
The bone marrow microenvironment provides a crucial hematopoietic niche for survival and differentiation of hematopoietic progenitor/stem cells (HPSCs). The dysfunctional microenvironment in myelodysplastic syndrome (MDS) may provide a new source of prognostic and diagnostic information and even provide insight into the pathophysiology of the disease. We used tissue microarray (TMA) techniques combined with semi-automated image acquisition using double immunofluorescence and confocal microscopy to methodically and quantitatively analyze the interrelationships among key components of the bone marrow microenvironment and their relationships to CD34+ hematopoietic progenitor/stem cells (HPSCs) in intact human bone marrow derived from archival diagnostic paraffin-embedded core biopsy specimens representing benign (NL), MDS, and acute myeloid leukemia (AML) diagnoses.
Whole bone marrow core biopsies (13 NL, 11 MDS, 7 AML) and 1 mmTMA cores (5 NL, 6 MDS, 4 AML) were evaluated. The area occupied by stromal cell populations was assessed using freely available ImageJ software. Adjacency of CD34+ HPSCs to specific cell populations was manually quantitated on double immunofluorescent-stained whole TMA core images.
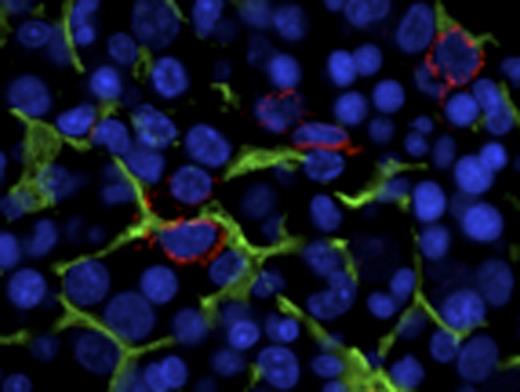
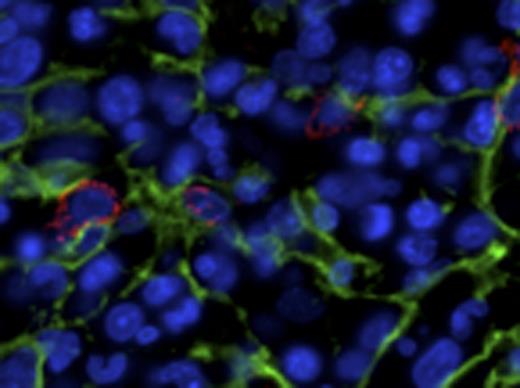
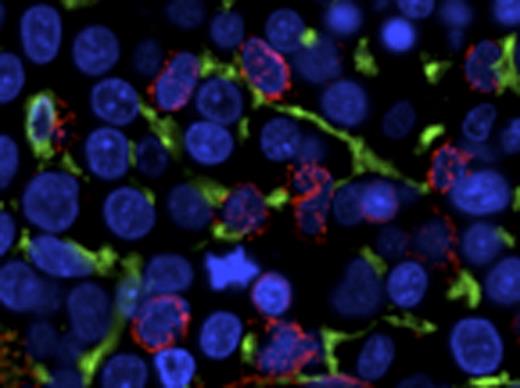
CD271 (low-affinity nerve growth factor receptor/pNGFR) highlights an extensive arborizing MSC population, whereas nestin and CD146 (melanoma cell adhesion molecule, MCAM) localize to specific vascular compartments. In MDS, CD271+ MSCs are markedly increased as compared to benign marrow (p=0.012), whereas there is no significant change in CD146, nestin, or CD163+ macrophage populations (Table 1). We document an intimate and conserved relationship of the CD271+ MSC population to CD34+ HPSCs and quantitate the preservation of this relationship in MDS (Fig 1, Table 2). Remarkably, the CD271+ MSC population is in intimate contact with the majority of CD34+ HPSCs (86% on average) across NL, MDS and AML marrows, whereas no significant contact is seen with nestin+ or CD146+ vascular elements. In benign bone marrow expression of the pro-survival chemokine CXCL12 is largely restricted to the vasculature, whereas in MDS and AML CD271+ MSCs abnormally express CXCL12.
We propose that CD271+ MSCs are candidates for a pathophysiologic role in MDS, and are candidate prognostic/diagnostic markers. We hypothesize that the relationship of MDS and AML CD34+ blasts with abnormal CD271+ MSC likely exposes neoplastic CD34+ HPSCs to aberrant contact-dependent signaling via the chemokine CXCL12 or other signals. We propose that the increased, dysfunctional, and spatially disarranged CD271+ arborizing MSC infrastructure may contribute to the ineffective hematopoiesis that is a defining feature of MDS by promoting inappropriate proliferation/survival of CD34+ HPSCs and by failing to support trafficking of maturing hematopoietic cells to microenvironmental compartments where they receive specific contact-dependent signals.
Quantification of % bone marrow area encompassed by CD271, CD146, nestin, and CD163+ cells
| . | CD271 . | CD146 . | nestin . | CD163 . | ||||
|---|---|---|---|---|---|---|---|---|
| . | N . | mean+/−std dev . | n . | mean+/−std dev . | n . | mean+/−std dev . | n . | mean+/−std dev . |
| NL | 14 | 3.1 +/− 3.2% | 16 | 0.6 +/− 0.9% | 14 | 0.0 +/− 0.0% | 6 | 12.6 +/− 4.9% |
| MDS | 13 | 9.1 +/− 8.7% | 10 | 0.6 +/− 0.6% | 10 | 0.1 +/− 0.1% | 5 | 23.5 +/− 17.8% |
| AML | 10 | 7.1 +/− 5.3% | 10 | 0.6 +/− 1.0% | 9 | 0.7 +/− 0.2% | 4 | 11.5 +/− 2.2% |
| Total | 37 | 6.3 +/− 6.6% | 36 | 0.6 +/− 0.8% | 33 | 0.1 +/− 0.4% | 15 | 15.9 +/− 11.4% |
| . | . | Mann-Whitney U test p values . | . | . |
|---|---|---|---|---|
| Normal vs MDS | 0.012 | 0.28 | 0.29 | 0.40 |
| Normal vs AML | 0.064 | 0.79 | 0.16 | 0.40 |
| . | . | Mann-Whitney U test p values . | . | . |
|---|---|---|---|---|
| Normal vs MDS | 0.012 | 0.28 | 0.29 | 0.40 |
| Normal vs AML | 0.064 | 0.79 | 0.16 | 0.40 |
NL
RA5Q
RAEB2
NL
RA5Q
RAEB2
CD34+ HPSCs are in intimate and conserved contact with CD271+ MSCs at baseline and in myeloid neoplasia. CD34+ HPSCs (red) are in intimate contact with NGFR+ arborizing stromal cells (green). Representative photomicrographs of benign (NL), low-grade myelodysplastic syndrome/5Q minus (RA5Q), and high grade myelodysplastic syndrome/refractory anemia with excess blasts 2 (RAEB2).
Quantification of % CD34+ HPSCs in contact with CD271, CD146, nestin, and CD163+ cell types
| . | CD271 . | CD146 . | nestin . | CD163 . | ||||
|---|---|---|---|---|---|---|---|---|
| . | n . | mean+/−std dev . | n . | mean+/−std dev . | n . | mean+/−std dev . | n . | mean+/−std dev . |
| NL | 6 | 82 +/− 10% | 5 | 0.0 +/− 0.0% | 4 | 1.0 +/− 2.1% | 6 | 27 +/− 23% |
| MDS | 5 | 88 +/− 9% | 5 | 0.2 +/− 0.5% | 4 | 1.3 +/− 1.6% | 5 | 16 +/− 16% |
| AML | 4 | 88 +/− 5% | 4 | 0.2 +/− 0.3% | 3 | 0.5 +/− 0.8% | 4 | 15 +/− 6% |
| Total | 15 | 86 +/− 7% | 14 | 0.1 +/− 0.3% | 12 | 1.0 +/− 0.2% | 15 | 20 +/− 17% |
| . | Kruskall Wallis test p values, adjusted for multiple comparisons . | . | ||
|---|---|---|---|---|
| versus CD271 | — | <0.001 | <0.001 | 0.003 |
| . | Kruskall Wallis test p values, adjusted for multiple comparisons . | . | ||
|---|---|---|---|---|
| versus CD271 | — | <0.001 | <0.001 | 0.003 |
Greenberg:amgen: Consultancy, Research Funding; onconova: Research Funding; glaxosmithkline: Research Funding; novartis: Consultancy, Research Funding.
Author notes
Asterisk with author names denotes non-ASH members.


This feature is available to Subscribers Only
Sign In or Create an Account Close Modal