Abstract
Abstract 2112
Iron overload (IO) either through blood transfusions or increased gastrointestinal absorption is associated with organ dysfunction and increased morbidity and mortality in patients with various hematological disorders including thalassemia. Despite improved methods of iron load detection and chelation therapy, patients still continue to be at risk for iron-associated toxicities. Methods for predicting IO include serum ferritin, liver iron content by MRI, and cardiac MRI T2*.
Limited information is available regarding the effects of IO on the different metabolic systems in the liver and heart, which may change with chelation therapy. Different chelators, including deferoxamine (DFO), deferiprone (DFP) and deferasirox (DFX), chelate iron at different rates and effectiveness from the liver and heart. The liver is involved in maintenance of glucose and lipid homeostasis, and iron-triggered injury increases secondary metabolites including triacylglycerols and glucose. IO alters the stability of hepatic and myocardial lysosomal membranes releasing higher levels of lysosomal enzymes in liver compared to heart in animal models. These and other metabolic pathways have not been studied extensively in iron-overloaded patients. The new technology of metabolomics allows for the concurrent measurement and analysis of multiple metabolites and has the potential to provide more valuable information on the metabolic systems affected by iron overload that could have clinical relevance.
To determine if novel metabolomics technologies can identify specific metabolites and pathways affected by iron overload including energy, carbohydrate, and lipid metabolism.
In this pilot project, we included twelve iron overloaded patients (thalassemia major N=7, thalassemia intermedia N=2, hemoglobin H disease N=2, pure red cell aplasia N=1) (age > 18 years) and 12 sex and age-matched controls. Clinical parameters including age, sex, chelator therapy, pre-transfusion hemoglobin, serum ferritin, liver iron content, and cardiac MRI T2* were collected on patient samples. The metabolite profile on fasting serum samples was analyzed in triplicate using gas chromatography-mass spectrometry (GC-MS) along with MetaboliteDetector a software. Significant metabolites were identified using multivariate regression analysis by supervised projection methods (two-way orthogonal partial least squares discriminant analysis, O2PLS-DA) using Simca-P (Umetrics).
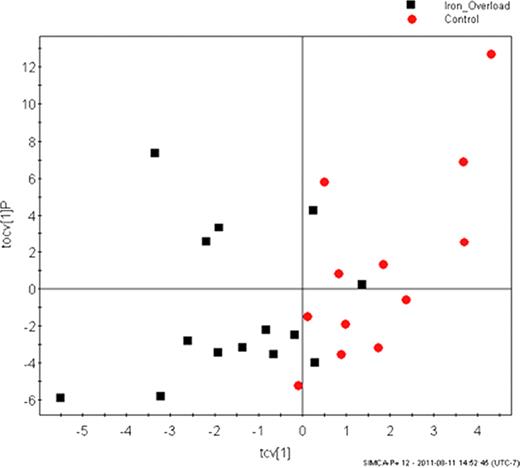
A total of 291 analytes were detected and quantified for each samples by GC-MS metabolomics. Clear differences were detected in serum metabolite profiles between patients with iron overload and control samples (p = 0.03) (Figure 1). Metabolite differences between the two groups consisted of amino acids, their breakdown products, and sugars. Multivariate regression analysis showed correlation between the different metabolite profiles and diagnosis of thalassemia major (p = 0.02). No significant differences were seen comparing age, sex, pre-transfusion hemoglobin, serum ferritin, LIC, and cardiac MRI T2*. There was a non-significant but detectable difference observed in the metabolic profile of the 3 patients on combination therapy with DFO and DFP (p<0.3) suggesting possible differences related to the presence DFP.
We conclude that metabolomics is a valid and useful tool to detect differences in the iron-associated metabolic changes in iron overloaded patients, specifically, thalassemia major. Combination therapy with DFO and DFP has a possibly different metabolic profile compared to other chelators. Further work is needed to delineate the specific metabolic changes due to iron chelation, specifically, effects on oxidative damage, as chelation therapy is known to reduce the levels of non-transferrin bound iron and reactive oxygen species. A larger sample size may also be needed to further detect any metabolite differences in relation to organ iron load.
Scores plot from the orthogonal partial least squares discriminant analysis comparing patients with iron overload (black squares) with age- and sex-matched controls (red circles). Each point represents a single serum sample, and the position related to the measured metabolite concentrations. A unique pattern was observed between the two groups (p=0.03).
Scores plot from the orthogonal partial least squares discriminant analysis comparing patients with iron overload (black squares) with age- and sex-matched controls (red circles). Each point represents a single serum sample, and the position related to the measured metabolite concentrations. A unique pattern was observed between the two groups (p=0.03).
No relevant conflicts of interest to declare.
Author notes
Asterisk with author names denotes non-ASH members.


This feature is available to Subscribers Only
Sign In or Create an Account Close Modal