Abstract
The oncoprotein BCR-ABL transforms myeloid progenitor cells and is responsible for the development of chronic myeloid leukemia (CML). In transformed cells, BCR-ABL suppresses apoptosis as well as autophagy, a catabolic process in which cellular components are degraded by the lysosomal machinery. The mechanism by which BCR-ABL suppresses autophagy is not known. Here we report that in both mouse and human BCR-ABL–transformed cells, activating transcription factor 5 (ATF5), a prosurvival factor, suppresses autophagy but does not affect apoptosis. We find that BCR-ABL, through PI3K/AKT/FOXO4 signaling, transcriptionally up-regulates ATF5 expression and that ATF5, in turn, stimulates transcription of mammalian target of rapamycin (mTOR; also called mechanistic target of rapamycin), a well-established master negative-regulator of autophagy. Previous studies have shown that the BCR-ABL inhibitor imatinib mesylate induces both apoptosis and autophagy, and that the resultant autophagy modulates the efficiency by which imatinib kills BCR-ABL–transformed cells. We demonstrate that imatinib-induced autophagy is because of inhibition of the BCR-ABL/PI3K/AKT/FOXO4/ATF5/mTOR pathway that we have identified in this study.
Introduction
BCR-ABL is an oncogene derived from the translocation between chromosomes 9 and 22 that can transform myeloid progenitor cells and which drives the development of chronic myeloid leukemia (CML; reviewed in Melo and Barnes1 ). BCR-ABL encodes a constitutively active protein tyrosine kinase that exerts its oncogenic function by activating a cascade of intracellular signaling pathways, which leads to increased survival and proliferation and limited dependence on growth factors. For example, BCR-ABL stimulates PI3K/AKT signaling, which in turn suppresses forkhead O (FOXO) transcription factors, resulting in increased proliferation and survival.2,3 FOXO transcription factors have been shown to play an important role in CML.2
Imatinib mesylate, also called Gleevec or STI571, has revolutionized the treatment of CML and is now the standard first-line therapy provided to CML patients (reviewed in Druker4 ). Imatinib is a relatively specific tyrosine kinase inhibitor that targets the ATP-binding domain of BCR-ABL and suppresses its enzymatic activity. Inhibition of BCR-ABL tyrosine kinase activity by imatinib results in induction of cell death, because of both a decrease of intracellular survival signals and a relative increase in proapoptotic signals.
Recently, it has been found that treatment of BCR-ABL–transformed cells with imatinib also induces autophagy.5 Autophagy is a degradative process that results in the breakdown of intracellular organelles and proteins within lysosomes. Intriguingly, autophagy can contribute to either survival or death dependent on cellular context.6-8 The finding that imatinib induces autophagy in BCR-ABL–transformed cells implies that BCR-ABL suppresses autophagy through a pathway (or pathways) that remains to be identified.
Activating transcription factor 5 (ATF5) is a member of the cAMP response element binding (CREB)/ATF subfamily of basic leucine zipper transcription factors.9 A role for ATF5 in promoting cell survival was first suggested from gene expression profiling experiments, which revealed that Atf5 was the gene most down-regulated in IL-3–dependent murine hematopoietic cells after apoptosis induction elicited by cytokine deprivation.10 A variety of subsequent functional experiments confirmed this proposal. For example, ectopic expression of ATF5 in mouse myeloid progenitor cells blocks apoptosis induced by IL-3 depletion.11 Significantly, ATF5 has been found to be overexpressed in—and contributes to the survival of—a wide variety of human cancer cell lines and tumors.12,13 In light of the important role of ATF5 in the survival of myeloid progenitors and solid tumor cells, we sought to investigate the function of ATF5 in BCR-ABL–transformed myeloid leukemia cells.
Methods
Cell lines and culture
Cells (32D, 32D/BCR-ABL, and 32D/BCR-ABL; T315I) were obtained or generated as previously described.14 K562 cells were purchased from ATCC and maintained in RPMI 1640 medium supplemented with 10% FBS. Human peripheral blood cells (Conversant Healthcare Systems Inc) were obtained from 3 individuals in chronic-phase CML, 2 of whom had not been treated with imatinib and 1 of whom was undergoing active treatment (supplemental Table 1, available on the Blood Web site; see the Supplemental Materials link at the top of the online article). The cells were maintained in RPMI medium supplemented with 20% FBS and 1 ng/mL IL-3 (PeproTech), 3 ng/mL IL-6 (PeproTech), and 6 ng/mL SCF (PeproTech). pBABE or pBABE-PIK3CA-E545K (Addgene) were introduced into 32D/BCR-ABL cells and stable cell lines were generated by puromycin selection. For ectopic ATF5 expression, p3XFLAG (Sigma-Aldrich), or p3XFLAG-ATF5 were stably transfected into K562 cells and selected using neomycin.
Cell viability assay
Cells (32D or 32D/BCR-ABL) were stably transduced with viruses containing a nonsilencing (NS) or ATF5 shRNA (supplemental Table 2). Cell viability was assessed every day for 4 days using the MTT assay.
Cell death assay
Immunoblot analysis
Cells were cultured in the presence or absence of 1 ng/mL IL-3 for 24 hours, 5-10μM imatinib (Novartis) for 16 to 48 hours, 20μM LY294002 (Cayman Chemical) for 48 hours, 20μM rapamycin (CalBiochem) for 48 hours, or as a control DMSO, and immunoblot analysis was performed as previously described.14 Cell lysates were resolved on a 10% or 15% SDS-PAGE gel and membranes were incubated with one of the following Abs: ATF5 (GeneTex Inc or Abcam), β-actin (ACTB) or tubulin (both from Sigma-Aldrich), p62 (Santa Cruz Biotechnology Inc), phospho-AKT, LC3B, mTOR or phospho-mTOR (all from Cell Signaling Technology Inc). In an immunoblot ATF5 is a doublet, which is evident on 15% but not 10% SDS-PAGE gels (supplemental Figure 1). LC3B-II immunoblots were quantified using Image J software, and the levels of LC3B-II was normalized to ACTB levels.
Fluorescence microscopy
To monitor GFP-LC3B localization, 32D/BCR-ABL or K562 cells stably expressing an NS or ATF5 shRNA were transiently transfected with pEGFP-LC3B (Addgene), and GFP fluorescence was recorded using a Zeiss Axio Imager.Z2 fluorescence microscope (Carl Zeiss Microimaging Inc) equipped with a Zeiss AxioCam digital camera and using a ×40 objective lens. Images were visualized using Zeiss AxioVision 4.8.1 software. For quantification, 7-10 fields each consisting of 40-200 GFP-positive cells were used to calculate the number of cells with GFP-LC3B puncta relative to the total number of GFP-positive cells. For the experiment in Figure 7B, 32D/BCR-ABL or K562 cells transiently expressing GFP-LC3B were treated with either DMSO, rapamycin (20μM for 24 or 48 hours, respectively) or PP242 (Sigma-Aldrich; 4μM for 24 or 48 hours, respectively). For bafilomycin A1 staining, K562 cells stably transduced with viruses expressing a NS or ATF5 shRNA were incubated in the medium in the presence or absence of 10nM bafilomycin A1 (Sigma-Aldrich) for 2 hours. Cells were then stained with 1μg/mL acridine orange (Sigma-Aldrich) for 1 hour. Fluorescence of acridine orange was recorded using a Zeiss AxioVert 200 equipped with a QICAM Fast 1394 digital camera (QImaging) and using a ×20 objective lens. Images were visualized using OpenLab software (PerkinElmer).
qRT-PCR
Cells were cultured in the presence or absence of 1 ng/mL IL-3 for 24 hours, 5-10μM imatinib for 16 to 48 hours, 20μM LY294002 for 18-72 hours, or as a control DMSO, and total RNA was isolated and qRT-PCR was performed as previously described13 using primers listed in supplemental Table 3.
Luciferase reporter assay
Fragments from the Atf5 (1548 bp) and mTor (539, 1010, 2017, and 3007 bp) promoters were PCR amplified from BAC clones (ATCC) using primers containing NotI sites. PCR products were then digested by NotI and inserted into pGL4.14 (luc2/Hygro; Promega). In some experiments, after transfection with the reporter constructs, 32D/BCR-ABL cells were treated with either DMSO, 5μM imatinib for 24 hours, or 20μM LY294002 for 18-48 hours, 20μM PHT-427 (Selleck Chemicals) for 24 hours, or 10μM JAK inhibitor I (CalBiochem) for 24 hours. Luciferase assays were performed as previously described.14
ChIP assays
Cells (32D/BCR-ABL; 3 × 10⁷) were incubated in the presence or absence of 5μM imatinib for 24 hours, and ChIP experiments were performed as previously described14 using an ATF5 or FOXO4 Ab (Santa Cruz Biotechnology Inc). Primers used for detection of specific regions of mTOR and ATF5 promoters are listed in supplemental Table 4.
Statistical analyses
All analyses were performed in R 2.12.1, a system for statistical computation and graphics.15 For the expression data, logarithmic transformation was applied before the Welch 2-sample t test16 was performed. For CML patient samples, the paired t test was performed. Cell death (y) was measured as a proportion of dead cells among all cells measured by annexin V–PE staining. The arcsine (sqrt(y)) transformation17 was applied to the raw data to homogenize the variance before the Welch 2-sample t test was performed. A linear mixed-effects model was fit to the logarithmic transformed viability data with treatment as a fixed effect and experiment day as a random effect to determine whether the viability differs between treatments using R package nlme_3.1-97.18,19
Results
ATF5 suppresses cell death in normal but not BCR-ABL–transformed cells
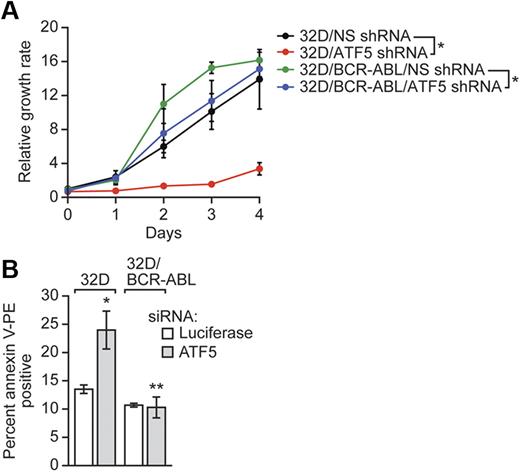
As a first step toward understanding the role of ATF5 in BCR-ABL–transformed cells, we used RNA interference to knockdown ATF5 in murine myeloid 32D cells stably transformed with BCR-ABL (32D/BCR-ABL cells) or, as a control, parental 32D cells. Previous studies have shown that ATF5 is expressed in nontransformed hematopoietic cells and cell lines10,11 (also see Figure 3). We measured the growth rate of 32D or 32D/BCR-ABL cells expressing either an ATF5 shRNA or, as a control, a nonsilencing (NS) shRNA. Figure 1A shows, consistent with our previous study,11 that shRNA-mediated knockdown of ATF5 in 32D cells resulted in substantially slower growth. By contrast, knockdown of ATF5 had only a modest effect on growth of 32D/BCR-ABL cells at early times (days 2 and 3) and no effect at later times (day 4). Analysis of cell death by annexin V–PE staining revealed that siRNA-mediated ATF5 knockdown (supplemental Figure 2) induced cell death in 32D cells, as expected, but not in 32D/BCR-ABL cells (Figure 1B, supplemental Figure 3), explaining the differential effect on growth in the 2 cell lines. These results indicate that in contrast to nontransformed murine myeloid cells,10,11 ATF5 does not promote survival or suppress cell death in BCR-ABL–transformed cells.
ATF5 suppresses cell death in normal but not BCR-ABL–transformed cells. (A) Cell viability analysis in 32D or 32D/BCR-ABL cells stably expressing a nonsilencing (NS) or ATF5 shRNA. Error bars represent SD. For each cell line, values were normalized to those observed at day 0. (B) 32D or 32D/BCR-ABL cells were treated with a luciferase or ATF5 siRNA and monitored for cell death by annexin V–PE staining. Error bars represent SD. *P < .05; **P > .05.
ATF5 suppresses cell death in normal but not BCR-ABL–transformed cells. (A) Cell viability analysis in 32D or 32D/BCR-ABL cells stably expressing a nonsilencing (NS) or ATF5 shRNA. Error bars represent SD. For each cell line, values were normalized to those observed at day 0. (B) 32D or 32D/BCR-ABL cells were treated with a luciferase or ATF5 siRNA and monitored for cell death by annexin V–PE staining. Error bars represent SD. *P < .05; **P > .05.
ATF5 inhibits autophagy in BCR-ABL–transformed cells
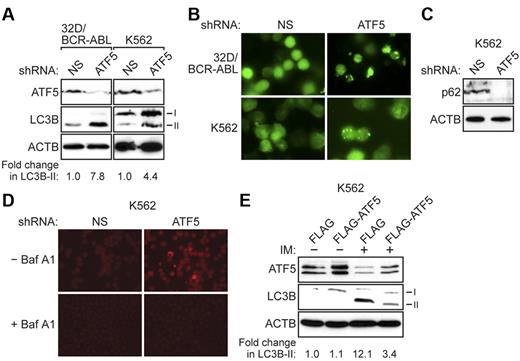
ATF5 is a well-established regulator of apoptosis, and several proteins, such as BCL2 family members20 and p5321 , have been found to affect both apoptosis and autophagy. To investigate the possible role of ATF5 in regulating autophagy in BCR-ABL–transformed cells, we monitored the levels of a well-characterized autophagy marker called LC3B-II, a lipidated form of light chain 3 (LC3B), which undergoes posttranslational modifications during autophagy.22,23 The immunoblot analysis of Figure 2A shows that ATF5 knockdown resulted in increased LC3B-II levels in 32D/BCR-ABL cells and in K562 cells, a human BCR-ABL+ CML cell line. Quantification of the immunoblots revealed that ATF5 knockdown resulted in a 7.8-fold increase in LC3B-II levels in 32D/BCR-ABL cells and a 4.4-fold increase in K562 cells. By contrast, in 32D cells ATF5 knockdown resulted in a marginal increase in LC3B-II levels (1.5-fold; supplemental Figure 4), indicating that ATF5 does not have a major role in regulating autophagy in 32D cells.
ATF5 inhibits autophagy in BCR-ABL–transformed cells. (A) 32D/BCR-ABL or K562 cells treated with either a NS or ATF5 shRNA were monitored for expression of ATF5 and LC3B by immunoblot analysis. β-actin (ACTB) was monitored as a loading control. The fold change in LC3B-II levels on ATF5 knockdown was quantified by measuring the intensity of the LC3B-II signal in the immunoblots and normalizing to ACTB levels. (B) 32D/BCR-ABL or K562 cells ectopically expressing a GFP-LC3B fusion protein were treated with either a NS or ATF5 shRNA and analyzed by fluorescence microscopy. Representative images are shown. (C) Immunoblot analysis of p62 levels in K562 cells expressing a NS or ATF5 shRNA. (D) K562 cells expressing a NS or ATF5 shRNA were stained with acridine orange in the absence or presence of bafilomycin A1 (Baf A1). (E) Immunoblot analysis of ATF5 and LC3B levels in K562 cells stably expressing FLAG or FLAG-ATF5, and treated in the absence or presence of imatinib (IM; 10μM for 48 hours).
ATF5 inhibits autophagy in BCR-ABL–transformed cells. (A) 32D/BCR-ABL or K562 cells treated with either a NS or ATF5 shRNA were monitored for expression of ATF5 and LC3B by immunoblot analysis. β-actin (ACTB) was monitored as a loading control. The fold change in LC3B-II levels on ATF5 knockdown was quantified by measuring the intensity of the LC3B-II signal in the immunoblots and normalizing to ACTB levels. (B) 32D/BCR-ABL or K562 cells ectopically expressing a GFP-LC3B fusion protein were treated with either a NS or ATF5 shRNA and analyzed by fluorescence microscopy. Representative images are shown. (C) Immunoblot analysis of p62 levels in K562 cells expressing a NS or ATF5 shRNA. (D) K562 cells expressing a NS or ATF5 shRNA were stained with acridine orange in the absence or presence of bafilomycin A1 (Baf A1). (E) Immunoblot analysis of ATF5 and LC3B levels in K562 cells stably expressing FLAG or FLAG-ATF5, and treated in the absence or presence of imatinib (IM; 10μM for 48 hours).
To verify these results, we performed a second autophagy assay in which 32D/BCR-ABL or K562 cells were transfected with a plasmid expressing a GFP-LC3B fusion protein.22,23 Under normal conditions, GFP-LC3B is uniformly distributed in the cytosol, whereas the appearance of GFP-LC3B–labeled puncta indicates the formation of autophagosomes. The immunofluorescence results of Figure 2B (quantified in supplemental Figure 5) show that ATF5 knockdown resulted in a significant increase in formation of GFP-LC3B puncta, consistent with the results of Figure 2A.
Autophagy is a dynamic process that involves the formation of autophagosomes and their subsequent fusion with lysosomes to form autolysosomes, whose contents are then degraded by lysosomal enzymes (see supplemental Figure 6). In principle, the accumulation of LC3B-II can result from the inhibition of fusion between lysosomes and autophagosomes, rather than the completion of autophagy.22,23 To confirm that ATF5 knockdown induces autophagy, we performed 2 additional experiments to monitor the formation of autolysosomes and the completion of autophagy. First, we measured the levels of p62 (also known as SQSTM1), a protein that is incorporated into the completed autophagosome and subsequently degraded in the autolysosome.22-24 Thus, steady-state levels of p62 provide a measure of autophagic status. Figure 2C shows that knockdown of ATF5 in K562 cells resulted in a substantial reduction in p62 protein levels. Second, to visualize autolysosomes directly, K562 cells were stained with acridine orange, a pH-dependent autofluorescent dye that concentrates in acidic vesicles, such as autolysosomes.25-27 Figure 2D shows that K562 cells expressing an ATF5 shRNA exhibited punctate structures indicative of autolysosome formation. As expected, treatment of cells with bafilomycin A1, an inhibitor of vacuolar H+ ATPase that increases the pH of acidic compartments,28 diminished punctate acridine orange staining. Taken together, the results of Figures 2A through D indicate that ATF5 inhibits autophagy in BCR-ABL–transformed cells.
Consistent with previous reports,5 imatinib treatment induced autophagy in both human (Figure 2E, supplemental Figure 7) and mouse (supplemental Figure 8) BCR-ABL–transformed cells, as evidenced by elevated LC3B-II levels. To determine the role of ATF5 in imatinib-induced autophagy, we ectopically expressed ATF5 (FLAG-ATF5) in K562 cells, or as a control the empty expression vector (FLAG), and then treated cells with imatinib. In this experiment, as well as all subsequent experiments using imatinib, we used a sublethal dose of imatinib to ensure that cell viability was not affected (supplemental Figure 9). Significantly, ectopic expression of FLAG-ATF5 substantially reduced the level of imatinib-induced autophagy in K562 cells (Figure 2E). By contrast, ectopic expression of FLAG-ATF5 in 32D cells failed to inhibit autophagy induced by IL-3 depletion (supplemental Figure 10), consistent with the results of supplemental Figure 4. Collectively, the results described above show that in both untreated and imatinib-treated BCR-ABL–transformed cells, but not nontransformed cells, autophagy is regulated by ATF5.
BCR-ABL regulates ATF5 expression independent of IL-3
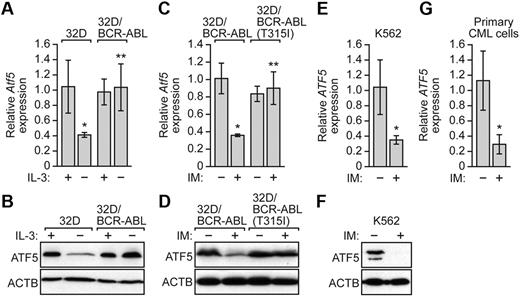
Previous studies have shown that ATF5 is overexpressed in a wide variety of human solid cancer cell lines and tumors,12,13 which prompted us to analyze ATF5 expression in BCR-ABL–transformed cells. To monitor ATF5 expression in BCR-ABL–transformed cells, we performed quantitative real-time RT-PCR (qRT-PCR). Figure 3A shows, as expected from previous studies,10,11 that Atf5 expression was down-regulated in 32D cells after IL-3 withdrawal. By contrast, Atf5 mRNA levels remained unchanged on IL-3 withdrawal in 32D/BCR-ABL cells. Likewise, ATF5 protein levels were reduced in 32D cells but not in 32D/BCR-ABL cells after IL-3 deprivation (Figure 3B). The results of Figure 3B also show that ATF5 is not overexpressed in BCR-ABL–transformed cells.
BCR-ABL regulates ATF5 expression independent of IL-3. (A) qRT-PCR analysis monitoring Atf5 expression in 32D or 32D/BCR-ABL cells cultured in the presence or absence of IL-3. Error bars represent SD. (B) Immunoblot analysis of ATF5 levels in 32D or 32D/BCR-ABL cells cultured in the presence or absence of IL-3. (C) qRT-PCR monitoring Atf5 expression in 32D/BCR-ABL or 32D/BCR-ABL(T315I) cells treated in the absence or presence of imatinib (10μM for 16 hours). Error bars represent SD. (D) Immunoblot analysis of ATF5 levels in 32D/BCR-ABL or 32D/BCR-ABL(T315I) cells in the absence or presence of imatinib (10μM for 16 hours). (E) qRT-PCR analysis monitoring ATF5 expression in K562 cells treated with or without imatinib (10μM for 48 hours). Error bars represent SD. (F) Immunoblot analysis of ATF5 levels in K562 cells treated with or without imatinib (10μM for 48 hours). (G) qRT-PCR monitoring of ATF5 expression in human peripheral blood cells isolated from chronic-phase CML patients (n = 3). Cells were treated in the absence or presence of imatinib (10μM for 16 hours). Error bars represent SE. *P < .05; **P > .05.
BCR-ABL regulates ATF5 expression independent of IL-3. (A) qRT-PCR analysis monitoring Atf5 expression in 32D or 32D/BCR-ABL cells cultured in the presence or absence of IL-3. Error bars represent SD. (B) Immunoblot analysis of ATF5 levels in 32D or 32D/BCR-ABL cells cultured in the presence or absence of IL-3. (C) qRT-PCR monitoring Atf5 expression in 32D/BCR-ABL or 32D/BCR-ABL(T315I) cells treated in the absence or presence of imatinib (10μM for 16 hours). Error bars represent SD. (D) Immunoblot analysis of ATF5 levels in 32D/BCR-ABL or 32D/BCR-ABL(T315I) cells in the absence or presence of imatinib (10μM for 16 hours). (E) qRT-PCR analysis monitoring ATF5 expression in K562 cells treated with or without imatinib (10μM for 48 hours). Error bars represent SD. (F) Immunoblot analysis of ATF5 levels in K562 cells treated with or without imatinib (10μM for 48 hours). (G) qRT-PCR monitoring of ATF5 expression in human peripheral blood cells isolated from chronic-phase CML patients (n = 3). Cells were treated in the absence or presence of imatinib (10μM for 16 hours). Error bars represent SE. *P < .05; **P > .05.
The results of Figure 3A and B raised the possibility that in 32D/BCR-ABL cells, BCR-ABL was responsible for promoting ATF5 expression in the absence of IL-3. To test this idea, we inhibited BCR-ABL in 32D/BCR-ABL cells by addition of imatinib. As a control, we analyzed in parallel 32D cells transformed with an imatinib-resistant BCR-ABL mutant, BCR-ABL(T315I).29 Figure 3C shows that imatinib treatment substantially reduced Atf5 mRNA levels in 32D/BCR-ABL cells but not in 32D/BCR-ABL(T315I) cells. Similar results were obtained at the protein level (Figure 3D). Collectively, these results demonstrate that BCR-ABL promotes ATF5 expression in murine myeloid 32D/BCR-ABL cells.
To investigate whether BCR-ABL also promotes ATF5 expression in human leukemic cells, we treated K562 cells with imatinib and monitored ATF5 expression. The results of Figure 3E and F verify that in K562 cells ATF5 mRNA and protein levels decreased after imatinib treatment. Moreover, imatinib reduced ATF5 expression in primary peripheral blood cells isolated from CML patients (Figure 3G). Taken together, these results demonstrate that in BCR-ABL–transformed cells, BCR-ABL regulates ATF5 expression.
BCR-ABL stimulates ATF5 transcription through PI3K/AKT/FOXO4 signaling
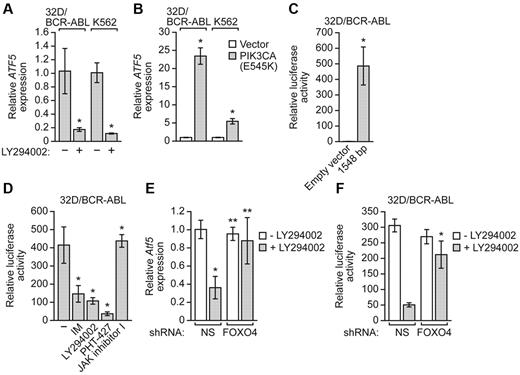
We have previously found that PI3K/AKT signaling, one of the major regulatory pathways downstream of BCR-ABL and often essential for cancer cell survival,3 can regulate ATF5 expression.13 We therefore asked whether BCR-ABL–mediated stimulation of ATF5 expression requires PI3K/AKT signaling. To test this possibility, we first treated 32D/BCR-ABL and K562 cells with a PI3K inhibitor, LY294002.30 Figure 4A shows by qRT-PCR that in both cell lines LY294002 treatment substantially reduced ATF5 expression. Next, we performed the reciprocal experiment in which we overexpressed a constitutively active PI3K mutant, PIK3CA(E545K).31 The qRT-PCR analysis of Figure 4B shows that expression of PIK3CA(E545K) in 32D/BCR-ABL or K562 cells substantially increased ATF5 expression relative to that obtained with a vector control. These qRT-PCR results were confirmed by immunoblotting in 32D/BCR-ABL cells (see Figure 5A-B). Based on these results, we conclude that PI3K/AKT signaling promotes ATF5 expression in BCR-ABL–transformed cells.
BCR-ABL stimulates ATF5 transcription through PI3K/AKT/FOXO4 signaling. (A) qRT-PCR monitoring ATF5 expression in 32D/BCR-ABL or K562 cells treated in the absence of presence of the PI3K inhibitor LY294002 (20μM for 48-72 hours). Error bars represent SD. (B) qRT-PCR monitoring ATF5 expression in 32D/BCR-ABL or K562 cells expressing either empty vector or a vector encoding PIK3CA(E545K). Error bars represent SD. (C) Luciferase reporter assays. A 1548-bp Atf5 promoter fragment, or as a control empty vector, was tested for its ability to drive a heterologous firefly luciferase gene after transient transfection in 32D/BCR-ABL cells. Error bars represent SD. (D) Luciferase reporter assays. 32D/BCR-ABL cells transfected with the reporter construct containing 1548 bp of the Atf5 promoter were treated with either DMSO, imatinib (5μM for 24 hours), LY294002 (20μM for 48 hours), PHT-427 (20μM for 24 hours), or JAK inhibitor I (10μM for 24 hours). Error bars represent SD. (E) qRT-PCR monitoring Atf5 expression in 32D/BCR-ABL cells stably expressing either a NS or FOXO4 shRNA and treated in the absence or presence of LY294002 (20μM for 18 hours). Error bars represent SD. (F) Luciferase reporter assay. 32D/BCR-ABL cells transfected with the reporter construct containing 1548 bp of the Atf5 promoter and expressing either an NS or FOXO4 shRNA were treated in the absence of presence of LY294002 (20μM for 18 hours). Error bars represent SD. *P < .05; **P > .05.
BCR-ABL stimulates ATF5 transcription through PI3K/AKT/FOXO4 signaling. (A) qRT-PCR monitoring ATF5 expression in 32D/BCR-ABL or K562 cells treated in the absence of presence of the PI3K inhibitor LY294002 (20μM for 48-72 hours). Error bars represent SD. (B) qRT-PCR monitoring ATF5 expression in 32D/BCR-ABL or K562 cells expressing either empty vector or a vector encoding PIK3CA(E545K). Error bars represent SD. (C) Luciferase reporter assays. A 1548-bp Atf5 promoter fragment, or as a control empty vector, was tested for its ability to drive a heterologous firefly luciferase gene after transient transfection in 32D/BCR-ABL cells. Error bars represent SD. (D) Luciferase reporter assays. 32D/BCR-ABL cells transfected with the reporter construct containing 1548 bp of the Atf5 promoter were treated with either DMSO, imatinib (5μM for 24 hours), LY294002 (20μM for 48 hours), PHT-427 (20μM for 24 hours), or JAK inhibitor I (10μM for 24 hours). Error bars represent SD. (E) qRT-PCR monitoring Atf5 expression in 32D/BCR-ABL cells stably expressing either a NS or FOXO4 shRNA and treated in the absence or presence of LY294002 (20μM for 18 hours). Error bars represent SD. (F) Luciferase reporter assay. 32D/BCR-ABL cells transfected with the reporter construct containing 1548 bp of the Atf5 promoter and expressing either an NS or FOXO4 shRNA were treated in the absence of presence of LY294002 (20μM for 18 hours). Error bars represent SD. *P < .05; **P > .05.
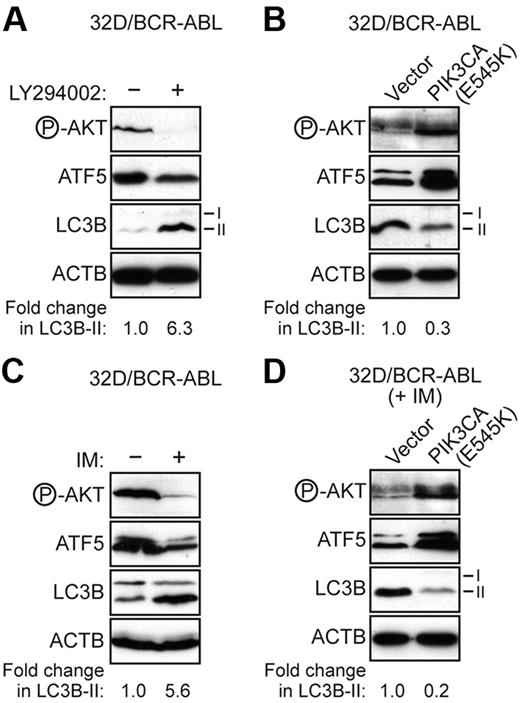
Signaling through PI3K/AKT inhibits autophagy in BCR-ABL–transformed cells. (A) Immunoblot analysis monitoring the levels of phosphorylated AKT, ATF5, LC3B, and ACTB in 32D/BCR-ABL cells treated in the absence or presence of LY294002 (20μM for 48 hours). (B) Immunoblot analysis monitoring the levels of phosphorylated AKT, ATF5, LC3B, and ACTB in 32D/BCR-ABL cells expressing either empty vector or a vector encoding PIK3CA(E545K). (C) Immunoblot analysis monitoring phosphorylated AKT, ATF5, and LC3B levels in 32D/BCR-ABL cells treated with imatinib (5μM for 24 hours). (D) Immunoblot analysis monitoring phosphorylated AKT, ATF5, and LC3B levels in imatinib-treated 32D/BCR-ABL cells (5μM for 24 hours) expressing empty vector or PIK3CA(E545K).
Signaling through PI3K/AKT inhibits autophagy in BCR-ABL–transformed cells. (A) Immunoblot analysis monitoring the levels of phosphorylated AKT, ATF5, LC3B, and ACTB in 32D/BCR-ABL cells treated in the absence or presence of LY294002 (20μM for 48 hours). (B) Immunoblot analysis monitoring the levels of phosphorylated AKT, ATF5, LC3B, and ACTB in 32D/BCR-ABL cells expressing either empty vector or a vector encoding PIK3CA(E545K). (C) Immunoblot analysis monitoring phosphorylated AKT, ATF5, and LC3B levels in 32D/BCR-ABL cells treated with imatinib (5μM for 24 hours). (D) Immunoblot analysis monitoring phosphorylated AKT, ATF5, and LC3B levels in imatinib-treated 32D/BCR-ABL cells (5μM for 24 hours) expressing empty vector or PIK3CA(E545K).
To determine whether the BCR-ABL/PI3K/AKT signaling pathway promotes ATF5 expression at the transcriptional level, we derived a reporter construct in which 1548 bp of the murine Atf5 promoter was fused to the firefly luciferase gene. Figure 4C shows that this Atf5-directed reporter was transcriptionally active when introduced into 32D/BCR-ABL cells by transient transfection. Consistent with the results described in Figures 3C and 4A, treatment of 32D/BCR-ABL cells with the BCR-ABL inhibitor imatinib, the PI3K inhibitor LY294002 or the AKT/PDPK1 inhibitor PHT-42732 substantially reduced Atf5 promoter-directed luciferase activity (Figure 4D). BCR-ABL also signals through JAK/STAT pathways.33 However, treatment of 32D/BCR-ABL cells with a JAK inhibitor (JAK inhibitor I34 ) had no effect on Atf5 reporter activity. Collectively, these results demonstrate that in BCR-ABL–transformed cells, transcription of ATF5 is promoted through PI3K/AKT signaling.
We next sought to understand in greater detail how PI3K/AKT signaling induces ATF5 expression. Previous studies have shown that BCR-ABL/PI3K/AKT signaling inhibits the activity of forkhead transcription factors of the FOXO family, constituting an important survival mechanism in hematopoietic cells.2 We therefore investigated whether PI3K/AKT-mediated inhibition of FOXO family members had a role in regulating ATF5 transcription in BCR-ABL–transformed cells. A prediction of this model is that inhibition of PI3K/AKT signaling would lead to the activation of FOXO family members, one or more of which would repress ATF5 expression.
To test this model, we analyzed whether knockdown of FOXO1, FOXO3A, or FOXO4 (supplemental Figure 11A) prevented the loss of ATF5 expression after PI3K/AKT inhibition. We chose to analyze these 3 FOXO members because they had been previously shown to be the main targets of AKT in CML.35 The qRT-PCR analysis revealed that knockdown of FOXO4 (Figure 4E), but not FOXO1 or FOXO3A (supplemental Figure 11B), rescued Atf5 expression to near normal levels after addition of LY294002. Similarly, knockdown of FOXO4 rescued expression of the Atf5 promoter-driven luciferase reporter gene after addition of LY294002 (Figure 4F). Collectively, these results suggest that PI3K/AKT signaling promotes ATF5 expression by inhibiting the activity of FOXO4, a repressor of ATF5 transcription.
Signaling through PI3K/AKT inhibits autophagy in BCR-ABL–transformed cells
Previous studies have shown that PI3K/AKT signaling has an important role in suppressing autophagy.36 We therefore asked whether PI3K/AKT signaling also inhibits autophagy in BCR-ABL–transformed cells. Figure 5A shows that addition of the PI3K inhibitor LY294002 resulted in increased LC3B-II levels. Conversely, ectopic expression of the constitutively active PI3KCA(E545K) mutant resulted in decreased LC3B-II levels (Figure 5B).
We next tested whether PI3K/AKT signaling plays an essential role in the regulation of autophagy by BCR-ABL. Figure 5C shows, as expected, that imatinib treatment inhibited PI3K/AKT signaling, as evidenced by decreased AKT phosphorylation, diminished ATF5 expression and induced autophagy. Ectopic expression of PIK3CA(E545K) in imatinib-treated 32D/BCR-ABL cells increased AKT phosphorylation and ATF5 expression, and substantially suppressed autophagy (Figure 5D). Thus, PI3K/AKT signaling has an essential role in BCR-ABL–mediated autophagy regulation.
mTOR, a master negative regulator of autophagy, is an ATF5 target gene
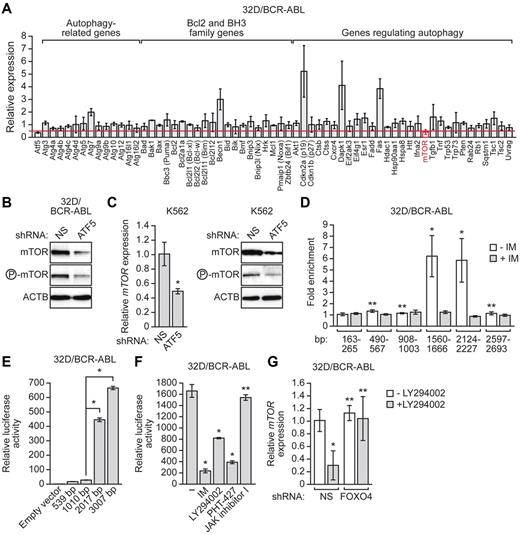
Because ATF5 is a transcription factor it seemed most likely that ATF5 regulates autophagy by stimulating the expression of one or more genes encoding an autophagy regulator. To identify putative ATF5 target genes we adopted a candidate-based approach. We assembled a panel of 62 genes that, based on previous studies, have been implicated in autophagy, and analyzed their expression in 32D/BCR-ABL cells after shRNA-mediated knockdown of ATF5. The qRT-PCR results of Figure 6A and supplemental Figure 12 show that of these 62 genes, knockdown of ATF5 resulted in a ≥ 2-fold decrease in only one gene, the mammalian target of rapamycin (mTOR, also called mechanistic target of rapamycin). mTOR encodes a conserved serine/threonine kinase that controls cell growth by activating protein synthesis, transcription and ribosome biogenesis, and by inhibiting mRNA degradation and autophagy.37 Consistent with the qRT-PCR results of Figure 6A, immunoblot analysis confirmed that after ATF5 knockdown in 32D/BCR-ABL cells, the levels of both total mTOR and phosphorylated mTOR decreased (Figure 6B). Moreover, ATF5 knockdown in human K562 cells also resulted in decreased levels of mTOR mRNA and protein (Figure 6C).
mTOR, a master negative regulator of autophagy, is an ATF5 target gene. (A) qRT-PCR analysis monitoring expression of 62 autophagy-related genes in 32D/BCR-ABL cells after treatment with an ATF5 siRNA. Expression of Atf5 is shown as a positive control. The expression of each gene was normalized to that obtained after treatment of cells with a luciferase siRNA. The red line indicates 2-fold decrease in expression. Error bars represent SD. (B) 32D/BCR-ABL cells treated with a NS or ATF5 shRNA were monitored for mTOR and phosphorylated mTOR levels by immunoblot analysis. (C) qRT-PCR analysis (left) or immunoblot analysis (right) monitoring mTOR expression in K562 cells treated with either a NS or ATF5 shRNA. Error bars represent SD. (D) ChIP analyses monitoring binding of ATF5 to the mTOR promoter in 32D/BCR-ABL cells in the presence or absence of imatinib (5μM for 24 hours). (E) Luciferase reporter assay. Fragments containing 539, 2010, 2017, or 3007 bp of the mTOR promoter, or as a control empty vector, were tested for their ability to drive heterologous firefly luciferase gene after transient transfection in 32D/BCR-ABL cells. Error bars represent SD. (F) 32D/BCR-ABL cells transfected with the reporter construct containing 3007 bp of the mTOR promoter were treated with either DMSO, imatinib (5μM for 24 hours), LY294002 (20μM for 24 hours), PHT-427 (20μM for 24 hours) or JAK inhibitor I (10μM for 24 hours). (G) qRT-PCR monitoring mTOR expression in 32D/BCR-ABL cells stably expressing either a NS or FOXO4 shRNA and treated in the absence or presence of LY294002 (20μM for 18 hours). Error bars represent SD. *P < .05; **P > .05.
mTOR, a master negative regulator of autophagy, is an ATF5 target gene. (A) qRT-PCR analysis monitoring expression of 62 autophagy-related genes in 32D/BCR-ABL cells after treatment with an ATF5 siRNA. Expression of Atf5 is shown as a positive control. The expression of each gene was normalized to that obtained after treatment of cells with a luciferase siRNA. The red line indicates 2-fold decrease in expression. Error bars represent SD. (B) 32D/BCR-ABL cells treated with a NS or ATF5 shRNA were monitored for mTOR and phosphorylated mTOR levels by immunoblot analysis. (C) qRT-PCR analysis (left) or immunoblot analysis (right) monitoring mTOR expression in K562 cells treated with either a NS or ATF5 shRNA. Error bars represent SD. (D) ChIP analyses monitoring binding of ATF5 to the mTOR promoter in 32D/BCR-ABL cells in the presence or absence of imatinib (5μM for 24 hours). (E) Luciferase reporter assay. Fragments containing 539, 2010, 2017, or 3007 bp of the mTOR promoter, or as a control empty vector, were tested for their ability to drive heterologous firefly luciferase gene after transient transfection in 32D/BCR-ABL cells. Error bars represent SD. (F) 32D/BCR-ABL cells transfected with the reporter construct containing 3007 bp of the mTOR promoter were treated with either DMSO, imatinib (5μM for 24 hours), LY294002 (20μM for 24 hours), PHT-427 (20μM for 24 hours) or JAK inhibitor I (10μM for 24 hours). (G) qRT-PCR monitoring mTOR expression in 32D/BCR-ABL cells stably expressing either a NS or FOXO4 shRNA and treated in the absence or presence of LY294002 (20μM for 18 hours). Error bars represent SD. *P < .05; **P > .05.
We sought to determine whether mTOR was a direct transcriptional target of ATF5. Analysis of the mTOR promoter did not reveal a perfect match to any of the previously identified consensus ATF5-binding sites,38-40 and we therefore took a functional approach to monitor ATF5 binding to the mTOR promoter using a ChIP assay. Using a series of primer pairs that spanned the mTOR promoter, we found that ATF5 bound to an mTOR promoter region encompassing 1560-2227 bp upstream of the transcription start site (Figure 6D, supplemental Figure 13). Importantly, binding of ATF5 to the mTOR promoter as measured by ChIP was abolished by imatinib treatment, which as shown above results in decreased ATF5 levels.
To determine whether this ATF5-binding region could confer mTOR expression, we derived a series of reporter constructs in which 539-, 1010-, 2017-, or 3007-bp fragments of the mTOR promoter were fused to the firefly luciferase gene. Notably, mTOR promoter fragments containing the ATF5-binding region conferred transcriptional activity in the luciferase reporter assay (Figure 6E). As expected, treatment of 32D/BCR-ABL cells with imatinib, LY294002 or PHT-427, but not JAK inhibitor I, substantially reduced mTOR promoter-directed luciferase activity (Figure 6F). Collectively, these results reveal mTOR as an ATF5 target gene.
Because knockdown of FOXO4 prevented the loss of ATF5 expression after PI3K/AKT inhibition (Figure 4E), we also analyzed the effect of FOXO4 knockdown on mTOR expression. Figure 6G shows, as expected, that treatment of 32D/BCR-ABL cells with LY294002 resulted in down-regulation of mTOR expression. Consistent with the results of Figure 4E, knockdown of FOXO4 prevented LY294002 from inhibiting mTOR expression. These results further support our conclusion that a BCR-ABL/PI3K/AKT/FOXO4/ATF5 pathway regulates mTOR expression.
ATF5 inhibits autophagy in BCR-ABL–transformed cells by transcriptional stimulation of mTOR expression
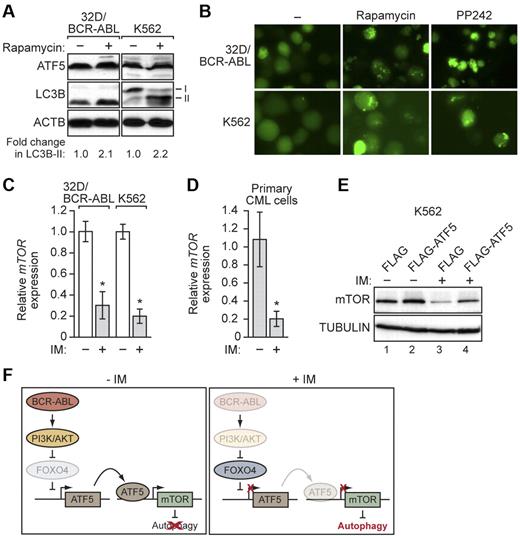
A variety of previous studies have implicated mTOR as a master negative-regulator of autophagy.37 Consistent with the results of a previous study,41 Figure 7A shows that in 32D/BCR-ABL and K562 cells inhibition of mTOR by addition of rapamycin42 promoted autophagy, as evidenced by increased LC3B-II levels. Similarly, treatment of 32D/BCR-ABL or K562 cells with rapamycin or another mTOR inhibitor, PP242,43 also promoted GFP-LC3B puncta formation (Figure 7B). Notably, rapamycin did not affect the levels of ATF5 (Figure 7A), ruling out the possibility that decreased ATF5 expression was indirectly responsible for the increased autophagy.
ATF5 inhibits autophagy in BCR-ABL–transformed cells by transcriptional stimulation of mTOR expression. (A) 32D/BCR-ABL or K562 cells treated with either DMSO or rapamycin were monitored for ATF5 and LC3B levels by immunoblot analysis. (B) 32D/BCR-ABL or K562 cells ectopically expressing a GFP-LC3B fusion protein were treated with DMSO, rapamycin, or PP242 and analyzed by fluorescence microscopy. Representative images are shown. (C) qRT-PCR monitoring mTOR mRNA levels in imatinib-treated 32D/BCR-ABL (5μM for 24 hours) and K562 cells (10μM for 48 hours). (D) qRT-PCR monitoring of mTOR expression in human peripheral blood cells isolated from chronic-phase CML patients (n = 3). Cells were treated in the absence or presence of imatinib (10μM for 16 hours). Error bars represent SE. *P < .05. (E) Immunoblot analysis of mTOR levels in K562 cells stably expressing FLAG or FLAG-ATF5, and treated in the absence or presence of imatinib (10μM for 48 hours). Tubulin was monitored as a loading control. (F) Schematic representation of the BCR-ABL/PI3K/AKT/FOXO4/ATF5/mTOR-mediated autophagy-inhibition pathway. Fading of a protein indicates loss of function.
ATF5 inhibits autophagy in BCR-ABL–transformed cells by transcriptional stimulation of mTOR expression. (A) 32D/BCR-ABL or K562 cells treated with either DMSO or rapamycin were monitored for ATF5 and LC3B levels by immunoblot analysis. (B) 32D/BCR-ABL or K562 cells ectopically expressing a GFP-LC3B fusion protein were treated with DMSO, rapamycin, or PP242 and analyzed by fluorescence microscopy. Representative images are shown. (C) qRT-PCR monitoring mTOR mRNA levels in imatinib-treated 32D/BCR-ABL (5μM for 24 hours) and K562 cells (10μM for 48 hours). (D) qRT-PCR monitoring of mTOR expression in human peripheral blood cells isolated from chronic-phase CML patients (n = 3). Cells were treated in the absence or presence of imatinib (10μM for 16 hours). Error bars represent SE. *P < .05. (E) Immunoblot analysis of mTOR levels in K562 cells stably expressing FLAG or FLAG-ATF5, and treated in the absence or presence of imatinib (10μM for 48 hours). Tubulin was monitored as a loading control. (F) Schematic representation of the BCR-ABL/PI3K/AKT/FOXO4/ATF5/mTOR-mediated autophagy-inhibition pathway. Fading of a protein indicates loss of function.
The results described above show that ATF5 stimulates mTOR expression and that in BCR-ABL–transformed cells ATF5 expression is inhibited by imatinib. A prediction of these 2 findings is that imatinib treatment will result in decreased levels of mTOR. Consistent with this prediction, Figure 7C shows that treatment of 32D/BCR-ABL or K562 cells with imatinib resulted in a substantial decrease in mTOR mRNA levels. Similar results were obtained in primary peripheral blood cells isolated from CML patients (Figure 7D). Importantly, the imatinib-mediated decrease in ATF5 and mTOR expression was also observed in the presence of the caspase inhibitor zVAD, indicating that the changes in gene expression were not because of apoptosis induction (supplemental Figure 14).
To confirm that the decrease in mTOR levels after imatinib treatment is because of the reduced amount of ATF5, we analyzed the effect of ectopic ATF5 expression. Figure 7E shows that ectopic expression of ATF5 in imatinib-treated K562 cells increased the level of mTOR (compare lanes 3 and 4) almost to that found in untreated cells (compare lane 4 to lanes 1 and 2). Collectively, these results indicate that decreased ATF5 levels after imatinib treatment is responsible, at least in part, for the reduction in mTOR and the induction of autophagy.
Discussion
Previous studies have found that treatment of BCR-ABL–transformed cells with imatinib promotes autophagy,5 implying that BCR-ABL is an autophagy repressor. However, the basis and pathway by which BCR-ABL suppresses autophagy remained to be determined. In this report, we elucidate a cell signaling and transcriptional pathway through which BCR-ABL regulates autophagy that is summarized in Figure 7D.
We find that BCR-ABL functions through the PI3K/AKT pathway to up-regulate the level of ATF5, a promoter-specific transcriptional activator. In addition, we show that in BCR-ABL–transformed cells, mTOR, a master negative-regulator of autophagy, is an ATF5 target gene. The increased ATF5 levels lead to elevated mTOR, resulting in autophagy suppression. Inhibition of BCR-ABL by imatinib results in decreased PI3K/AKT signaling and corresponding reductions in the levels of ATF5 and mTOR. Several previous expression profiling studies failed to observe the effect of imatinib on ATF5 and mTOR mRNA levels because the microarrays used lacked probes for these 2 genes.44,45
Previous studies have shown that PI3K/AKT signaling also stimulates mTOR activity through a complex protein phosphorylation pathway that involves several other components including tuberous sclerosis complex proteins TSC1 and TSC2, as well as the GTPase Rheb.46 Thus, in BCR-ABL–transformed cells PI3K/AKT activates mTOR through both transcriptional and posttranscriptional mechanisms.
We found that PI3K/AKT signaling up-regulates the level of ATF5 by inhibiting FOXO4, a repressor of ATF5 transcription. However, after addition of imatinib or LY294002 we could not detect binding of FOXO4 on the ATF5 promoter (supplemental Figure 15). These results suggest that FOXO4 regulates ATF5 expression indirectly and not by binding to the ATF5 promoter.
Collectively, our results are consistent with those of several other studies showing that: (1) although FOXO proteins have identical DNA-binding domains, their activities are highly distinct, and (2) FOXO proteins often affect transcriptional responses independently of promoter binding by, for example, interacting with other transcription factors and modulating their activities (reviewed in van der Vos and Coffer47 ).
The role of ATF5 as a prosurvival, antiapoptotic factor has been documented in a wide variety of mammalian cell lines and human tumors. To our knowledge, however, this is the first report of a role for ATF5 in the regulation of autophagy. We find that ATF5 function differs in nontransformed versus BCR-ABL–transformed cells. Specifically, in nontransformed cells, such as myeloid progenitors, ATF5 antagonizes apoptosis whereas in BCR-ABL–transformed cells ATF5 negatively modulates autophagy. The finding that ATF5 can affect either apoptosis or autophagy in a cell type-dependent manner highlights the linkage between these 2 cellular processes.
Studies in knockout mice have suggested that at least in some instances autophagy has a tumor suppressor function.8 Paradoxically, however, a variety of studies have found that autophagy can promote the survival of cancer cells, for example, after chemotherapy or radiotherapy.6,7 In BCR-ABL–transformed cells, modulating autophagy has been shown to affect the efficiency of cell killing by imatinib.5 Thus, it is possible that the BCR-ABL/PI3K/AKT/FOXO4/ATF5/mTOR pathway we have identified in this study could be beneficially targeted in the treatment of CML with imatinib or other agents. In support of this idea, inhibition of PI3K/AKT or mTOR signaling has been found to render CML cells more sensitive to imatinib treatment.8,48,49
An Inside Blood analysis of this article appears at the front of this issue.
The online version of this article contains a data supplement.
The publication costs of this article were defrayed in part by page charge payment. Therefore, and solely to indicate this fact, this article is hereby marked “advertisement” in accordance with 18 USC section 1734.
Acknowledgments
The authors thank members of the Green laboratory for critical discussions, and Sara Deibler for editorial support.
This work was supported by National Institutes of Health grant R01CA115817 (M.R.G.).
M.R.G. is an investigator of the Howard Hughes Medical Institute.
National Institutes of Health
Authorship
Contribution: Z.S. and M.R.G. designed all the experiments, analyzed all data, and wrote the paper; Z.S. performed the majority of the experiments, with the exception of the ChIP assays, which were performed by L.M.; J.E.S. assisted with immunoblotting and qRT-PCR experiments; and L.J.Z. provided statistical analysis of all the data.
Conflict-of-interest disclosure: The authors declare no competing financial interests.
Correspondence: Michael R. Green, Program in Gene Function and Expression, University of Massachusetts Medical School, 364 Plantation St, Worcester, MA 01605; e-mail: michael.green@umassmed.edu.

