Abstract
Extrahepatic manifestations of hepatitis C virus (HCV) infection occur in 40%-70% of HCV-infected patients. B-cell non-Hodgkin lymphoma is a typical extrahepatic manifestation frequently associated with HCV infection. The mechanism by which HCV infection of B cells leads to lymphoma remains unclear. Here we established HCV transgenic mice that express the full HCV genome in B cells (RzCD19Cre mice) and observed a 25.0% incidence of diffuse large B-cell non-Hodgkin lymphomas (22.2% in males and 29.6% in females) within 600 days after birth. Expression levels of aspartate aminotransferase and alanine aminotransferase, as well as 32 different cytokines, chemokines and growth factors, were examined. The incidence of B-cell lymphoma was significantly correlated with only the level of soluble interleukin-2 receptor α subunit (sIL-2Rα) in RzCD19Cre mouse serum. All RzCD19Cre mice with substantially elevated serum sIL-2Rα levels (> 1000 pg/mL) developed B-cell lymphomas. Moreover, compared with tissues from control animals, the B-cell lymphoma tissues of RzCD19Cre mice expressed significantly higher levels of IL-2Rα. We show that the expression of HCV in B cells promotes non-Hodgkin–type diffuse B-cell lymphoma, and therefore, the RzCD19Cre mouse is a powerful model to study the mechanisms related to the development of HCV-associated B-cell lymphoma.
Introduction
More than 175 million people worldwide are infected with hepatitis C virus (HCV), a positive-strand RNA virus that infects both hepatocytes and peripheral blood mononuclear cells.1 Chronic HCV infection may lead to hepatitis, liver cirrhosis, hepatocellular carcinomas2,3 and lymphoproliferative diseases such as B-cell non-Hodgkin lymphoma and mixed-cryoglobulinemia.1,4-6 B-cell non-Hodgkin lymphoma is a typical extrahepatic manifestation frequently associated with HCV infection7 with geographic and ethnic variability.8,9 Based on a meta-analysis, the prevalence of HCV infection in patients with B-cell non-Hodgkin lymphoma is approximately 15%.8 The HCV envelope protein E2 binds human CD81,10 a tetraspanin expressed on various cell types including lymphocytes, and activates B-cell proliferation11 ; however, the precise mechanism of disease onset remains unclear. We previously developed a transgenic mouse model that conditionally expresses HCV cDNA (nucleotides 294-3435), including the viral genes that encode the core, E1, E2, and NS2 proteins, using the Cre/loxP system (in core∼NS2 [CN2] mice).12,13 The conditional transgene activation of the HCV cDNA (core, E1, E2, and NS2) protects mice from Fas-mediated lethal acute liver failure by inhibiting cytochrome c release from mitochondria.13 In HCV-infected mice, persistent HCV protein expression is established by targeted disruption of irf-1, and high incidences of lymphoproliferative disorders are found in CN2 irf-1−/− mice.14 Infection and replication of HCV also occur in B cells,15,16 although the direct effects, particularly in vivo, of HCV infection on B cells have not been clarified.
To define the direct effect of HCV infection on B cells in vivo, we crossed transgenic mice with an integrated full-length HCV genome (Rz) under the conditional Cre/loxP expression system with mice expressing the Cre enzyme under transcriptional control of the B lineage–restricted gene CD19,17 we addressed the effects of HCV transgene expression in this study.
Methods
Animal experiments
Wild-type (WT), Rz, CD19Cre, RzCD19Cre mice (129/sv, BALB/c, and C57BL/6J mixed background), and MxCre/CN2-29 mice (C57BL/6J background) were maintained in conventional animal housing under specific pathogen-free conditions. All animal experiments were performed according to the guidelines of the Tokyo Metropolitan Institute of Medical Science or the Kumamoto University Subcommittee for Laboratory Animal Care. The protocol was approved by the Institutional Review Boards of both facilities.
Measurements of HCV protein and RNA
Mice were anesthetized and bled, and tissues (spleen, lymph nodes, liver, and tumors) were homogenized in lysis buffer (1% sodium dodecyl sulfate; 0.5% (wt/vol) nonyl phenoxypolyethoxylethanol; 0.15M NaCl; 10 mM tris(hydroxymethyl)aminomethane, pH 7.4) using a Dounce homogenizer. The concentration of HCV core protein in tissue lysates was measured using an HCV antigen enzyme-linked immunosorbent assay (ELISA; Ortho).18 HCV mRNA was isolated by a guanidine thiocyanate protocol using ISOGEN (Nippon Gene) and was detected by reverse transcription polymerase chain reaction (RT-PCR) amplification using primers specific for the 5′ untranslated region of the HCR6 sequence.19,20 Reverse transcription was performed using Superscript III reverse transcriptase (Invitrogen) with random primers. PCR primers NCR-F (5′-TTCACGCAGAAAGCGTCTAGCCAT-3′) and NCR-R (5′-TCGTCCTGGCAATTCCGGTGTACT-3′) were used for the first round of HCV cDNA amplification, and the resulting product was used as a template for a second round of amplification using primers NCR-F INNER (5′-TTCCGCAGACCACTATGGCT-3′) and NCR-R INNER (5′-TTCCGCAGACCACTATGGCT-3′).
Collection of serum for chemokine ELISA
Blood samples were collected from the supraorbital veins or by heart puncture of killed mice. Blood samples were centrifuged at 10 000g for 15 minutes at 4°C to isolate the serum.21 Serum concentrations of interleukin (IL)–1α, IL-1β, IL-2, IL-3, IL-4, IL-5, IL-6, IL-9, IL-10, IL-12(p40), IL-12(p70), IL-13, IL-17, Eotaxin, granulocyte colony-stimulating factor (CSF), granulocyte–macrophage–CSF, interferon (IFN)–γ, keratinocyte-derived chemokine (KC), monocyte chemotactic protein-1, macrophage inflammatory protein (MIP)–1α, MIP-1β, Regulated upon Activation, Normal T-cell Expressed, and Secreted, tumor necrosis factor-α, IL-15, fibroblast growth factor-basic, leukemia inhibitory factor, macrophage-CSF, human monokine induced by gamma interferon, MIP-2, platelet-derived growth factorβ, and vascular endothelial growth factor were measured using the Bio-Plex Pro assay (Bio-Rad). Serum soluble IL-2 receptor α (sIL-2Rα) concentrations were determined by ELISA (DuoSet ELISA Development System; R&D Systems). Serum aspartate aminotransferase (AST) and alanine aminotransferase (ALT) activities were determined using a commercially available kit (Transaminase CII test; Wako Pure Chemical Industries).
Histology and immunohistochemical staining
Mouse tissues were fixed with 4% formaldehyde (Mildform 10 N; Wako Pure Chemical Industries), dehydrated with an ethanol series, embedded in paraffin, sectioned (10-μm thick) and stained with hematoxylin and eosin. For tissue immunostaining, paraffin was removed from the sections using xylene following the standard method,14 and sections were incubated with anti-CD3 or anti-CD45R (Santa Cruz Biotechnology) in phosphate-buffered saline without Ca2+ and Mg2+ (pH 7.4) but with 5% skim milk. Next, the sections were incubated with biotinylated anti-rat immunoglobulin (Ig)G (1:500), followed by incubation with horseradish peroxidase-conjugated avidin-biotin complex (Dako Corp), and the color reaction was developed using 3,3′-diaminobenzidine. Sections were observed under an optical microscope (Carl Zeiss).
Detection of immunoglobulin gene rearrangements by PCR
Genomic DNA was isolated from tumor tissues, and PCR was performed as described.22 In brief, PCR reaction conditions were 98°C for 3 minutes; 30 cycles at 98°C for 30 seconds, 60°C for 30 seconds, 72°C for 1.5 minutes, and 72°C for 10 minutes. Mouse Vk genes were amplified using previously described primers.23 Amplification of mouse Vj genes was performed using Vκcon (5′-GGCTGCAGSTTCAGTGGCAGTGGRTCWGGRAC-3′; R, purine; W, A or T) and Jκ5 (5′-TGCCACGTCAACTGATAATGAGCCCTCTC-3′) as described.24
Results
Establishment of transgenic mice with B lineage–restricted HCV gene expression
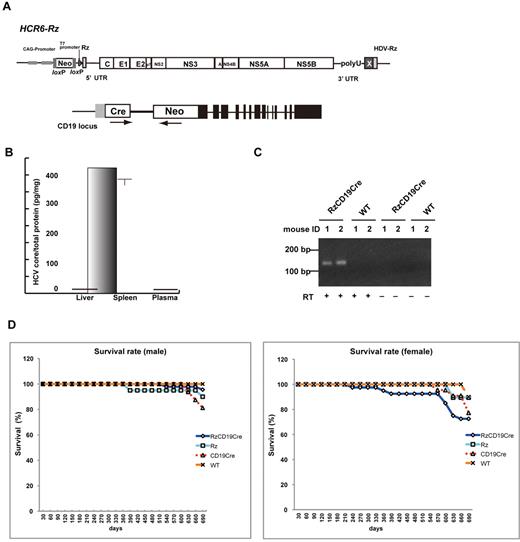
We defined the direct effect of HCV infection on B cells in vivo by crossing transgenic mice that had an integrated full-length HCV genome (Rz) under the conditional Cre/loxP expression system (Figure 1A upper schematic)12,19,25 with mice that expressed the Cre enzyme under transcriptional control of the B lineage–restricted gene CD1917 (RzCD19Cre; Figure 1A lower schematic). Expression of the HCV transgene in RzCD19Cre mice was confirmed by ELISA (Figure 1B); a substantial level of HCV core protein was detected in the spleen (370.9 ± 10.2 pg/mg total protein), but levels were lower in the liver (0.32 ± 0.03 pg/mg) and plasma (not detectable). RT-PCR analysis of peripheral blood lymphocytes (PBLs) from RzCD19Cre mice indicated the presence of HCV transcripts (Figure 1C). The weights of RzCD19Cre, Rz (with the full HCV genome transgene alone), CD19Cre (with the Cre gene knock-in at the CD19 gene locus) and WT mice were measured weekly for more than 600 days post birth; there were no significant differences between these groups (data not shown; the total number of transgenic and WT mice was approximately 200). The survival rate in each group was also measured for > 600 days (Figure 1D); survival in the female RzCD19Cre group was lower than that of the other groups.
Establishment of RzCD19Cre mice. (A) Schematic diagram of the transgene structure comprising the complete HCV genome (HCR6-Rz). HCV genome expression was regulated by the Cre/loxP expression cassette (top diagram). The Cre transgene was located in the CD19 locus (bottom diagram). (B) Expression of HCV core protein in the liver, spleen, and plasma of RzCD19Cre mice was quantified by core ELISA. Data represent the mean ± SD (n = 3). (C) Detection of HCV RNA in PBLs by RT-PCR. Samples that included the RT reaction are indicated by +, and those that did not include the RT reaction are indicated by –. (D) Survival rates of male and female RzCD19Cre mice (males, n = 45; females, n = 40), Rz mice (males, n = 20; females, n = 19), CD19Cre mice (males, n = 16; females, n = 22), and WT mice (males, n = 5; females, n = 10).
Establishment of RzCD19Cre mice. (A) Schematic diagram of the transgene structure comprising the complete HCV genome (HCR6-Rz). HCV genome expression was regulated by the Cre/loxP expression cassette (top diagram). The Cre transgene was located in the CD19 locus (bottom diagram). (B) Expression of HCV core protein in the liver, spleen, and plasma of RzCD19Cre mice was quantified by core ELISA. Data represent the mean ± SD (n = 3). (C) Detection of HCV RNA in PBLs by RT-PCR. Samples that included the RT reaction are indicated by +, and those that did not include the RT reaction are indicated by –. (D) Survival rates of male and female RzCD19Cre mice (males, n = 45; females, n = 40), Rz mice (males, n = 20; females, n = 19), CD19Cre mice (males, n = 16; females, n = 22), and WT mice (males, n = 5; females, n = 10).
The spontaneous development of B-cell lymphomas in the RzCD19Cre mouse
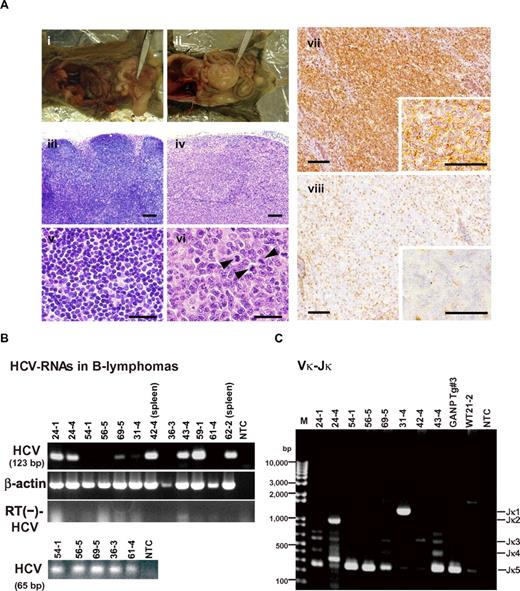
At 600 days post birth, mice (n = 140) were killed by bleeding under anesthesia, and tissues (spleen, lymph node, liver, and tumors) were excised and examined by hematoxylin and eosin staining (Figure 2A; supplemental Figure 1, available on the Blood Web site; see the Supplemental Materials link at the top of the online article). The incidence of B-cell lymphoma in RzCD19Cre mice was 25.0% (22.2% in males and 29.6% in females) and was significantly higher than the incidence in the HCV-negative groups (Table 1). This incidence is significantly higher than those of the other cell-type tumors developed spontaneously in all mouse groups (supplemental Table 1). Because nodular proliferation of CD45R-positive atypical lymphocytes was observed, lymphomas were diagnosed as typical diffuse B-cell non-Hodgkin lymphomas (Figure 2Aiv,vi-vii; supplemental Figure 1B,E,H,M). Mitotic cells were also positive for CD45R (Figure 2Avi arrowheads). CD3-positive T-lymphocytes were small and had a scattered distribution. Intrahepatic lymphomas had the same immunophenotypic characteristics as B-cell lymphomas (supplemental Figure 1K arrowheads, inset; 1L–N, ID No. 24-4, RzCD19Cre mouse); lymphoma tissues were markedly different compared with the control lymph node (Figure 2Ai,iii,v; ID No. 47-4, CD19Cre mouse) and liver (supplemental Figure 1J; ID No. 24-2, Rz mouse; tissues were from a littermate of the mice used to generate the data in supplemental Figure 1D-I,K-N). All samples were reviewed by at least 2 expert pathologists and classified according to World Health Organization classification.26 Lymphomas were mostly CD45R positive and located in the mesenteric lymph nodes (Figure 2A; supplemental Figure 1), and some were identified as intrahepatic lymphomas (incidence, 4.2%; supplemental Figure 1K-N). HCV gene expression was detected in all B-cell lymphomas of RzCD19Cre mice (Figure 2B).
Histopathologic analysis of B-cell lymphomas in RzCD19Cre mouse tissues. (A) Histologic analysis of tissues from a normal mouse (i, iii, v; CD19Cre mouse, ID No. 47-4, male) and a B-cell lymphoma from a RzCD19Cre mouse (ii, iv, vi; ID No. 69-5, male). Paraformaldehyde-fixed and paraffin-embedded tumor tissues were stained with hematoxylin and eosin (iii-vi) or immunostained using anti-CD45R (vii; bottom right, inset) and anti-CD3 (viii; bottom right, inset). Also shown is a macroscopic view of the lymphoma from a mesenchymal lymph node (ii, indicated by forceps), which is not visible in the normal mouse (i). Mitotic cells are indicated with arrowheads (vi). Scale bars: 100 μm (iii-iv, vii-viii) and 20 μm (v-vi, insets in vii-viii). (B) Expression of HCV RNA in B-cell lymphomas from RzCD19Cre mice was examined by RT-PCR. The first round of PCR amplification yielded a 123-base pair fragment of HCV cDNA (upper panel), and a second round of PCR amplification yielded a 65-base pair fragment (lower panel). The β-actin mRNA was a control. As an additional control, the first and second rounds of amplification were performed using samples that had not been subjected to reverse transcription. NTC, no-template control. (C) Ig gene rearrangements in the tumors of RzCD19Cre mice. Genomic DNA isolated from B-cell lymphoma tissues of RzCD19Cre mice (ID Nos. 24-1, 24-4, 54-1, 56-5, 69-5, 31-4, 42-4, 43-4) and spleen tissues of a WT mouse (ID No. 21-2) was PCR amplified using primers specific for Vκ-Jκ genes. Amplification of controls was performed using genomic DNA isolated from a GANP transgenic mouse (GANP Tg#3) and in the absence of template DNA (no-template control, NTC). M, DNA ladder marker.
Histopathologic analysis of B-cell lymphomas in RzCD19Cre mouse tissues. (A) Histologic analysis of tissues from a normal mouse (i, iii, v; CD19Cre mouse, ID No. 47-4, male) and a B-cell lymphoma from a RzCD19Cre mouse (ii, iv, vi; ID No. 69-5, male). Paraformaldehyde-fixed and paraffin-embedded tumor tissues were stained with hematoxylin and eosin (iii-vi) or immunostained using anti-CD45R (vii; bottom right, inset) and anti-CD3 (viii; bottom right, inset). Also shown is a macroscopic view of the lymphoma from a mesenchymal lymph node (ii, indicated by forceps), which is not visible in the normal mouse (i). Mitotic cells are indicated with arrowheads (vi). Scale bars: 100 μm (iii-iv, vii-viii) and 20 μm (v-vi, insets in vii-viii). (B) Expression of HCV RNA in B-cell lymphomas from RzCD19Cre mice was examined by RT-PCR. The first round of PCR amplification yielded a 123-base pair fragment of HCV cDNA (upper panel), and a second round of PCR amplification yielded a 65-base pair fragment (lower panel). The β-actin mRNA was a control. As an additional control, the first and second rounds of amplification were performed using samples that had not been subjected to reverse transcription. NTC, no-template control. (C) Ig gene rearrangements in the tumors of RzCD19Cre mice. Genomic DNA isolated from B-cell lymphoma tissues of RzCD19Cre mice (ID Nos. 24-1, 24-4, 54-1, 56-5, 69-5, 31-4, 42-4, 43-4) and spleen tissues of a WT mouse (ID No. 21-2) was PCR amplified using primers specific for Vκ-Jκ genes. Amplification of controls was performed using genomic DNA isolated from a GANP transgenic mouse (GANP Tg#3) and in the absence of template DNA (no-template control, NTC). M, DNA ladder marker.
Lymphoma incidence in HCV-expressing and control mice
| HCV expression . | Mouse genotype . | No. . | Incident B lymphoma, number (%) . | Incident T lymphoma, number (%) . |
|---|---|---|---|---|
| + | RzCD19Cre | 72 | 18 (25.0) | 3 (4.1) |
| − | Rz | 34 | 1 (2.9) | 1 (2.9) |
| − | CD19Cre | 22 | 2 (9.1) | 1 (4.5) |
| − | WT | 12 | 1 (8.3) | 1 (8.3) |
| HCV expression . | Mouse genotype . | No. . | Incident B lymphoma, number (%) . | Incident T lymphoma, number (%) . |
|---|---|---|---|---|
| + | RzCD19Cre | 72 | 18 (25.0) | 3 (4.1) |
| − | Rz | 34 | 1 (2.9) | 1 (2.9) |
| − | CD19Cre | 22 | 2 (9.1) | 1 (4.5) |
| − | WT | 12 | 1 (8.3) | 1 (8.3) |
To examine the Ig gene configuration in the B-cell lymphomas of the RzCD19Cre mice, genomic DNA was isolated and analyzed by PCR. Ig gene rearrangements were identified in each case (Figure 2C). Genomic DNA isolated from the tumors of a germinal center–associated nuclear protein (GANP) transgenic mouse (GANP Tg#3) yielded a predominant Jk5 PCR product (Figure 2C, Vκ-Jκ); a predominant JH1 product and a minor JH2 product (supplemental Figure 2, DH-JH) were also identified, as previously reported,22 indicating that the lymphoma cells proliferated from the transformation of an oligo B-cell clone. The B-cell lymphomas of 8 RzCD19Cre mice (mouse ID Nos. 24-1, 54-1, 56-5, 69-5, 42-4, 43-4, 36-3 [data not shown] and 62-2 [data not shown]) yielded a Jκ-5 gene amplification product, and the lymphomas from 3 other mice had the alternative gene configurations Jκ-1 (mouse ID No. 31-4), Jκ-2 (mouse ID No. 24-4) and Jκ-3 (mouse ID No. 42-4; Figure 2C). PCR amplification products from the genes JH4 (mouse ID Nos. 24-1, 24-4, 54-1, 43-4, 56-5, 69-5, 62-2 [data not shown], 36-3 [data not shown]), JH1 (mouse ID Nos. 31-4, 42-4) and JH3 (mouse ID Nos. 31-4, 42-4, 56-5, 43-4, 36-3 [data not shown]) were also detected (supplemental Figure 2). The mutation frequencies in the Jκ-1, -3 and -5 genes were the same as the mutation frequency in the genomic V-region gene.22 Few or no sequence differences in the variable region were identified among clones from which DNA was amplified. These results indicate the possibility that tumors judged as B-cell lymphomas based on pathology criteria were derived from the transformation of a single germinal center of B-cell origin.
To rule out the oncogenic effect caused by a transgenic integration into a specific genomic locus, we examined if HCV transgene inserted into another genomic site also causes B-cell lymphomas using another HCV transgenic mouse strain, MxCre/CN2-29 (supplemental Figure 3). Expression of the HCV CN2 gene (nucleotides 294-3435)12 was induced by the Mx promoter-driven cre recombinase with poly(I:C) induction14 (supplemental Figure 3A). HCV core proteins were detected in both normal spleen (mouse ID Nos. 2, 3, 4) and intra-splenic B-cell lymphoma tissues (mouse ID Nos. 5, 6, 7) of MxCre/CN2-29 mice but not in spleens of the CN2-29 mouse (mouse ID No. 1, Figure 3B). After 12 months, the MxCre/CN2-29 mice developed B-cell lymphomas in the spleen at a high incidence (33.3%: 3/9), whereas the CN2-29 mice did not (0/13; supplemental Figure 3C), indicating that the development of B-cell lymphomas in HCV transgenic mice occurred similarly to RzCD19Cre mice. MxCre/CN2-29 mice also developed hepatocellular carcinomas (10%, 360 days, 17%, 480 days, 50%, 600 days after onset of HCV expression; Sekiguchi et al, submitted).
The results obtained in 2 HCV transgenic mouse strains indicate that the expression of the HCV gene or the proteins indeed induces the spontaneous development of B-cell lymphomas irrespective of the integrated site in the mouse genome.
The levels of cytokines and chemokines in B-cell lymphomas and other tumors and in tumor-free control mice
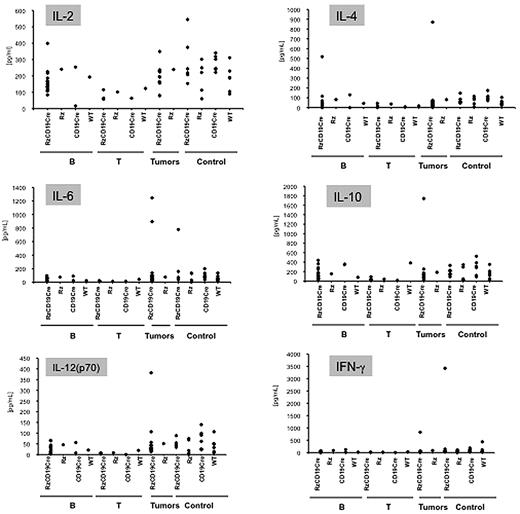
Abnormal induction of cytokine production occurs in HCV-associated non-Hodgkin lymphomas27,28 and in patients with chronic hepatitis.29,30 Therefore, we examined tumor cytokine and chemokine levels using a multisuspension array system. The levels of IL-2, IL-4, IL-6, IL-10, IL-12(p70), and IFN-γ (Figure 3), which may have a link with lymphoproliferation14 or lymphoma28,31 induced by HCV, and IL-1α, IL-1β, IL-3, IL-5, IL-9, IL-12(p40), IL-13, IL-17, Eotaxin, granulocyte-CSF, granulocyte–macrophage–CSF, KC, monocyte chemotactic protein-1, MIP-1α, MIP-1β, Regulated upon Activation, Normal T-cell Expressed, and Secreted, tumor necrosis factor-α, IL-15, fibroblast growth factor-basic, leukemia inhibitory factor, macrophage-CSF, human monokine induced by gamma interferon, MIP-2, platelet-derived growth factorβ and vascular endothelial growth factor (supplemental Figure 4) were measured in sera from mice with B-cell lymphomas, T-cell lymphomas, and other tumors and in sera from tumor-free RzCD19Cre, Rz, CD19Cre, and WT control mice. The levels of these cytokines and chemokines in sera from tumor-bearing RzCD19Cre mice with B-cell lymphomas were not significantly different from those of the control groups, and thus, changes in the expression of these cytokines and chemokines were not strictly correlated with the occurrence of B-cell lymphoma in RzCD19Cre mice.
Analysis of serum cytokine levels using a multisuspension array system. The serum concentration levels of IL-2, IL-4, IL-6, IL-10, IL-12(p70), and IFN-γ were measured in RzCD19Cre mice with B-cell lymphomas (B), T-cell lymphomas (T), and other tumors (mammary tumor, sarcoma, and hepatocellular carcinoma) and in tumor-free RzCD19Cre, Rz, CD19Cr,e and WT mice.
Analysis of serum cytokine levels using a multisuspension array system. The serum concentration levels of IL-2, IL-4, IL-6, IL-10, IL-12(p70), and IFN-γ were measured in RzCD19Cre mice with B-cell lymphomas (B), T-cell lymphomas (T), and other tumors (mammary tumor, sarcoma, and hepatocellular carcinoma) and in tumor-free RzCD19Cre, Rz, CD19Cr,e and WT mice.
The levels of amino transferases and sIL-2Rα in mice lacking or harboring B-cell lymphomas
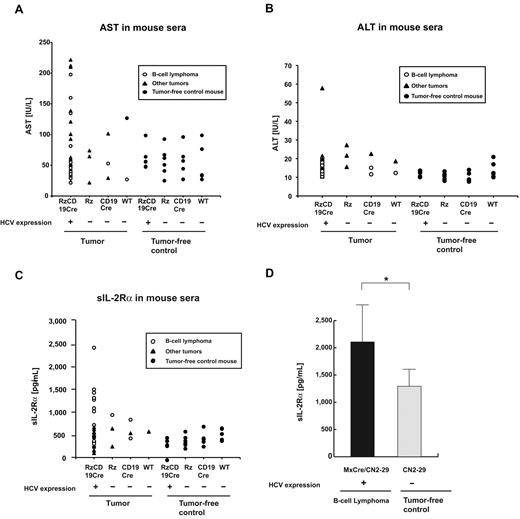
We also examined the levels of AST and ALT in the RzCD19Cre, Rz, CD19Cre, and WT mice. There were no significant differences in the levels of AST and ALT in the sera of mice lacking or harboring B-cell lymphomas (P > .05; Figure 4A-B; AST: RzCD19Cre mice with B-cell lymphomas, 72.2 ± 60.5 IU/L; normal controls, 55.2 ± 23.0 IU/L and ALT: RzCD19Cre mice with B-cell lymphomas, 14.2 ± 3.1 IU/L; normal controls, 11.5 ± 3.0 IU/L).
Serum titers of AST, ALT and soluble IL-2Rα in transgenic and control mice lacking or harboring B-cell lymphomas. (A-B) The AST (A) and ALT (B) assays were performed on serum samples from tumor-free control mice and the RzCD19Cre, Rz, CD19Cre and WT mice with or without B-cell lymphomas or other tumors. (C) ELISA analysis was performed to determine the sIL-2Rα concentration in serum samples from tumor-free control mice and the RzCD19Cre, Rz, CD19Cre, and WT mice with or without B-cell lymphomas or other tumors. (D) Concentration of soluble IL-2Rα in sera from transgenic (MxCre/CN2-29 or CN2-29) mice with or without B-cell lymphomas (*P < .05).
Serum titers of AST, ALT and soluble IL-2Rα in transgenic and control mice lacking or harboring B-cell lymphomas. (A-B) The AST (A) and ALT (B) assays were performed on serum samples from tumor-free control mice and the RzCD19Cre, Rz, CD19Cre and WT mice with or without B-cell lymphomas or other tumors. (C) ELISA analysis was performed to determine the sIL-2Rα concentration in serum samples from tumor-free control mice and the RzCD19Cre, Rz, CD19Cre, and WT mice with or without B-cell lymphomas or other tumors. (D) Concentration of soluble IL-2Rα in sera from transgenic (MxCre/CN2-29 or CN2-29) mice with or without B-cell lymphomas (*P < .05).
Finally, we examined the level of sIL-2Rα in the sera of the RzCD19Cre mice with B-cell lymphomas; sIL-2Rα is generated by proteolytic cleavage of IL-2Rα (CD25) residing on the surface of activated T and natural killer cells, monocytes, and certain tumor cells.24,32 The average sIL-2Rα level in the RzCD19Cre mice with B-cell lymphomas (830.3 ± 533.0 pg/mL) was significantly higher than that in the tumor-free control groups, including the RzCD19Cre, Rz, CD19Cre and WT mice (499.9 ± 110.2 pg/mL; P < .0057; Figure 4C). The average sIL-2Rα levels in other tumor-containing groups (430.46 ± 141.15 pg/mL) were not significantly different from those in the tumor-free control groups (P > .05; Figure 4C). Moreover, all RzCD19Cre mice with a relatively high level of sIL-2Rα (> 1000 pg/mL) presented with B-cell lymphomas (Figure 4C).
We also examined the level of sIL-2Rα in MxCre/CN2-29 mice and observed a significant increase in sIL-2Rα in mice that expressed HCV and that had B-cell lymphomas compared with tumor-free control (CN2-29) mice (Figure 4D).
Expression of IL-2Rα in B-cell lymphomas of the RzCD19Cre mice
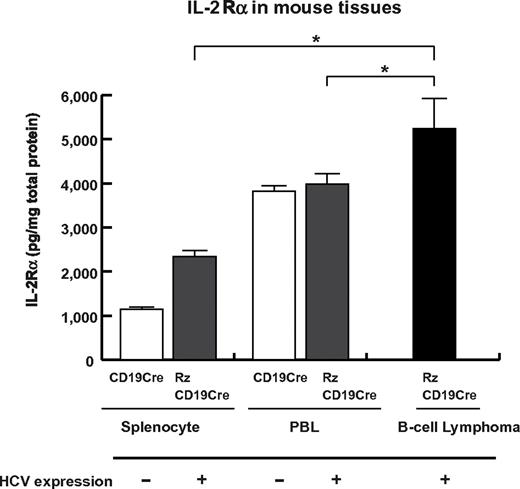
To examine whether sIL-2Rα was derived from lymphoma tissues, we quantified IL-2Rα concentrations in splenocytes, PBLs and B-cell lymphoma tissues (Figure 5). The concentration of IL-2Rα was significantly higher in splenocytes from RzCD19Cre mice compared with those from CD19Cre mice; the concentration was even higher in B-cell lymphoma tissues than in splenocytes from RzCD19Cre mice (Figure 5). These results strongly suggest that B-cell lymphomas directly contribute to the elevated serum concentrations of sIL-2Rα in RzCD19Cre mice.
Levels of IL-2Rα in transgenic and control mice lacking or harboring B-cell lymphomas. The expression level of IL-2Rα in splenocytes and PBLs from CD19Cre and RzCD19Cre mice and in B-cell lymphomas from RzCD19Cre mice was measured by ELISA. IL-2Rα levels per total protein are indicated (picograms per milligram). Data from quadruplicate samples are shown as the mean ± SD (*P < .05).
Levels of IL-2Rα in transgenic and control mice lacking or harboring B-cell lymphomas. The expression level of IL-2Rα in splenocytes and PBLs from CD19Cre and RzCD19Cre mice and in B-cell lymphomas from RzCD19Cre mice was measured by ELISA. IL-2Rα levels per total protein are indicated (picograms per milligram). Data from quadruplicate samples are shown as the mean ± SD (*P < .05).
Discussion
We have established HCV transgenic mice that have a high incidence of spontaneous B-cell lymphomas. In this animal model, the HCV transgene is expressed during the embryonic stage, and these RzCD19Cre mice are expected to be immunotolerant to the HCV transgene product. Thus, the results from this study reveal the potential for the HCV gene to induce B-cell lymphomas without inducing host immune responses against the HCV gene product. A retrospective study indicated that viral elimination reduced the incidence of malignant lymphoma in patients infected with HCV.33 The results in our study may be consistent with this retrospective observation, indicating the significance of the direct effect of HCV infection on B-cell lymphoma development. Another HCV transgenic mouse strain (MxCre/CN2-29) showed the similarly high incidence of B-cell lymphoma, which strongly supported that development of B-cell lymphomas occurred by the expression of HCV transgene.
Recent findings have revealed the significance of B lymphocytes in HCV infection of liver-derived hepatoma cells.34 In 4.2% of the RzCD19Cre mice, CD45R-positive intrahepatic lymphomas were identified, and infiltration of B cells into the hepatocytes was frequently observed (data not shown). These phenomena suggest that HCV could modify the in vivo tropism of B cells. The RzCD19Cre mouse is a powerful model system to address these mechanisms in vivo.
As a circulating membrane receptor, sIL-2Rα is localized in lymphoid cells and some other types of cancer cells and is highly expressed in several cancers35-40 and autoimmune diseases.41 Recent findings indicate a link between sIL-2Rα levels and hepatocellular carcinoma in Egyptian patients.42 Appearing on the surface of leukemic cells derived from B and pre-B lymphocytes and other leukemic cells, IL-2Rα is one of the subunits of the IL-2 receptor, which is composed of an α chain (CD25), a β chain (CD122), and a γ chain (CD132).43 IL-2R ectodomains are thought to be proteolytically cleaved from the cell surface34,44,45 instead of produced as a result of posttranscriptional splicing.24 In RzCD19Cre splenocytes, the level of IL-2Rα was higher than that in splenocytes from CD19Cre mice; however, serum concentrations of sIL-2Rα in RzCD19Cre mice without B-cell lymphomas did not show significant differences compared with other control groups (Rz, CD19Cre, and WT). These results indicate the possibility that HCV may increase IL-2Rα expression on B-cells; proteolytic cleavage of IL-2Rα was increased after B-cell lymphoma development in the RzCD19Cre mouse. The detailed mechanism that induces IL-2Rα as a result of HCV expression is still unclear at present, but we have found previously that the HCV core protein induces IL-10 expression in mouse splenocytes.14 IL-10 up-regulates the expression of IL-2Rα (Tac/CD25) on normal and leukemic B lymphocytes,46 and therefore, through IL-10, the HCV core protein might induce IL-2Rα in B cells of the RzCD19Cre mouse.
In conclusion, this study established an animal model that will likely provide critical information for the elucidation of molecular mechanism(s) underlying the spontaneous development of B-cell non-Hodgkin lymphoma after HCV infection. This knowledge should lead to therapeutic strategies to prevent the onset and/or progression of B-cell lymphomas.
The online version of this article contains a data supplement.
The publication costs of this article were defrayed in part by page charge payment. Therefore, and solely to indicate this fact, this article is hereby marked “advertisement” in accordance with 18 USC section 1734.
Acknowledgments
We thank Dr T. Ito for assistance with pathology characterization and Dr T. Munakata for valuable comments.
This work was supported by grants from the Ministry of Health and Welfare of Japan and the Cooperative Research Project on Clinical and Epidemiologic Studies of Emerging and Re-emerging Infectious Diseases.
Authorship
Contribution: K.T.-K. conceived of the project; K.K., M.K., and K.T.-K. designed the studies; Y.K., S.S., M. Saito, K.T., M. Satoh, M.T., and K.T.-K. performed experiments and analyses; N.S. and Y.H. provided scientific advice; and K.T.-K. wrote the manuscript.
Conflict-of-interest disclosure: The authors declare no competing financial interests.
Correspondence: Kyoko Tsukiyama-Kohara, Department of Experimental Phylaxiology, Faculty of Life Sciences, Kumamoto University, Kumamoto 860-8556, Japan; e-mail: kkohara@kumamoto-u.ac.jp.
References
Author notes
Y.K. and S.S. contributed equally to this work.

This feature is available to Subscribers Only
Sign In or Create an Account Close Modal