Abstract
Abstract 4838
Chronic myeloid leukemia (CML) is a clonal hematopoietic malignancy characterized by the presence of BCR/ABL fusion gene. The resulting protein has a high tyrosine kinase (TK) activity. The first-line treatment for CML is Imatinib, which allow the achievement of cytogenetic and molecular response in most of patients with CML in chronic phase. However, some patients do not respond to this treatment or lose their initial response. Imatinib has been reported to be incorporated into the cell through hOCT1 transporter (human organic cation transporter).
The aim of this study was to determine whether the expression of hOCT1 at diagnosis of CML influenced the achievement of molecular response.
We analyzed hOCT1 gene expression by quantitative PCR in 42 patients at diagnosis and 18 months after treatment with Imatinib. We compared the expression with the presence of compleat molecular response (CMR) at 18 months. We consider CMR when the Ratio (BCR-ABL/ABL)×100 was <0.1% (after International Scale correction). For statistical analysis methods we have used Kolmogorov-Smirnov and Mann-Whitney nonparametric methods.
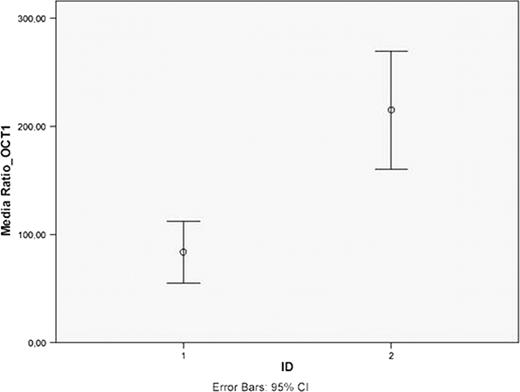
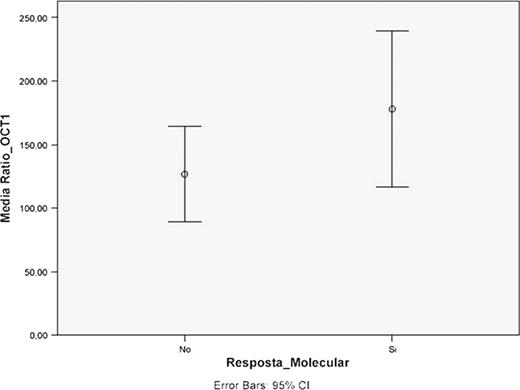
Of the 42 patients, 2 were in hematological response, 22 were in cytogenetic response and 18 in CMR at 18 months. We found a higher hOCT1 gene expression at 18 month than at diagnosis (53.3 versus 29.6, p<0.001) in all patients (Figure 1). We have found some tendency of higher hOCT1 expression at diagnosis in patients with CMR at 18 months than in those who did not had (25.5 versus 18.8, p = 0.07) (Figure 2).
The hOCT1 gene expression increases after Imatinib treatment.
The hOCT1 gene expression could be a useful technique to predict molecular response to Imatinib.
Partially funded by FICJ-P-EF-09, RD06/0020/1056 de RTICC and Novartis.
We want to thank Dr. David Marin for providing us plasmid for quantitative analysis.
hOCT1 gene expression in patients with (Si) and without (No) compleat molecular response at 18 months.
hOCT1 gene expression in patients with (Si) and without (No) compleat molecular response at 18 months.
No relevant conflicts of interest to declare.
Author notes
Asterisk with author names denotes non-ASH members.


This feature is available to Subscribers Only
Sign In or Create an Account Close Modal