

Abstract
Abstract 4591
Although the role of AHSCT1 is well established in multiple myeloma therapy, the role of the salvage (not “tandem”) AHSCT2 is less clear. However, most pts. undergo initial stem cell harvests with plans for eventual AHSCT2. To clarify the indications, the prognostic factors and the outcomes of AHSCT2 in relapsed myeloma, we analyzed our experience in 19 pts. (pts.) who underwent salvage AHSCT2 between the 1994–2008. Mean age at AHSCT1/2 was 54.58 (SD 7.96)/57.03 (SD 8.10) respectively; 15 (79.0%) were males. At the time of diagnosis, 7 (36.8%) pts. had ISS stage I, 6 (31.6%) stage II, 3(15.8%) stage III and in 3 (15.8%) the ISS stage could not be determined. Isotypes: IgG 11 (57.9%), IgA 4 (21.1%), 1 (5.3%) pt. had IgM and 3 (15.8%) had light chain myeloma. Cytogenetics were normal in 6 (31.6%), abnormal in 5 (26.3%) and unavailable for 8 (42.1%) pts. The most common therapy received prior to AHSCT1 was Vincristine/Adriamycin/Dexamethasone in 11 (57.9%) pts.; 7 pts. were exposed to novel agents. One pt. achieved complete response (CR), 15 (79.0%) pts. achieved partial response (PR) and 3 (15.8%) pts. had stable or progressive disease after receiving the initial treatment. All pts. proceeded to receive high dose therapy with Melphalan (MEL), 2 pts received fTBI in addition to MEL. Mean MEL dose was 190.00 mg/m2 (SD 23.01); 15 pts. received 200 mg/m2. All pts. received >2×10e6/kg of CD34+ cells in the first and second transplants. At D+100 after AHSCT1, responses were: 4 (21.1%) CR, 1 (5.3%) VGPR, 8 (42.1%) PR and 6 (31.6 %) with lesser responses. Therapy to prolong response or for salvage after AHSCT1 was given in all pts before AHSCT2, including Thalidomide in 6 (31.6%), Bortezomib in 4 (21.1%) and Lenalidomide in 2 (10.5) pts. Median time to progression after AHSCT1 was 318 days [95 % CI 110– 573]. Median interval between AHSCT1 and AHSCT2 was 896.74 days (SD: 698.34 days). At the time of AHSCT2, 4 (21.1%) were in PR, 15 (79.0%) had progressive disease. For AHSCT2, all pts. Received MEL, one pt. received MEL + Cytoxan and one pt. received MEL + Bortezomib. The median MEL dose/m2 was 175.56 (52.04).All pts. survived AHSCT2 to D+100, responses were as follows: 3 (15.8%) VGPR, 9 (47.4%) in PR; 7 (36.9) pts. had lesser responses. After AHSCT2, nine (47.4%) pts. had grade III toxicity and only one pt. had grade IV toxicity (avascular necrosis). Maintenance therapy after AHSCT2 included Bortezomib in 7 (36.8%) pts., Lenalidomide in 5 (26.3%) pts. and Thalidomide in 4 (21.1%) pts. After AHSCT2, the median overall survival (OS) was 658 days [95 % CI 326–1330] and progression free survival (PFS) after AHSCT2 was 237 days [95 % CI 121– 397] (Figure 1). OS probability at 6, 12, 24 months after AHSCT2 was 81.3, 75.0, 39.3 % respectively. For all pts., the median OS time (i.e. time from diagnosis to death or last follow-up) was 2187 days [95% CI 1413– 4126]. At the end of the follow up period, a total of 14 pts. had died. Causes of death were progression in 12 (63.2%) and sepsis in 2 pts. (10.5%). The number of previous lines of chemotherapy, interval between transplants, disease status at the time of AHSCT1/2, type of myeloma and MEL dose were not predictive of OS and PFS. In the multivariate analysis, only age by decade at AHSCT2 and male gender were independent predictors of OS after AHSCT2 (HR 4.037, P= 0.01), (HR 3.74, P=0.07) respectively. Similarly, in the multivariate analysis for PFS after AHSCT2, age at AHSCT2 was an unfavorable independent predictor (HR 3.48, P=0.009) whereas relapse free response more than 18 months after AHSCT1 was an independent favorable predictor (HR 0.198, P=0.007).Our results are consistent with the few studies examining the impact of salvage transplants for myeloma which report a median overall survival ranging from 20.7 to 38.1 months from the time of AHSCT2.We conclude that salvage AHSCT2 can positively impact PFS and OS but efforts to improve outcomes are mandatory.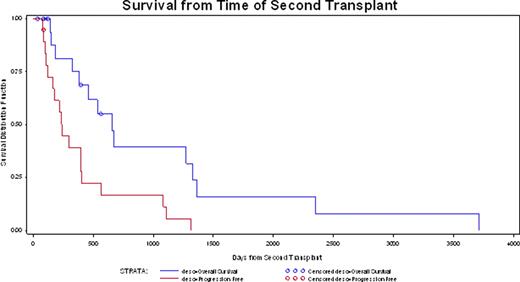
Figure

SEQ Figure ≂,* ARABIC 1
X-axis represents time from AHSCT2 in days. Y axis represents survival distribution. Blue line = OS, Red = PFS.
Disclosures:
No relevant conflicts of interest to declare.

This feature is available to Subscribers Only
Sign In or Create an Account Close Modal