Abstract
Abstract 3590
Genome-wide array or sequencing analyses are powerful tools for identifying genetic aberrations in cancers including leukaemias. However, the majority of these aberrations are likely to be random passenger events that do not drive clonal expansion. Currently, it is unknown whether cancers are maintained by a finite set of recurrent mutations similar for each patient or whether and to what extent malignancies are ‘personalised’, and also how molecular disease drivers evolve over time in the context of clinical intervention. The answers to these questions will determine whether future treatment modalities must be tailored according to individual and dynamic cancer characteristics. We hypothesized that differential quantitative high-resolution genome-wide array analysis of sequential samples from the same patients before treatment and at subsequent relapse would have the potential to identify emerging structural abnormalities with relevance to disease progression and/or response to treatment in a given patient. In order to test this hypothesis, we chose B-cell chronic lymphocytic leukaemia (CLL), because of its unique clinical characteristics, as our model to begin to evaluate the potential role of ‘companion diagnostics’ for this condition.
We analysed DNA samples of 80 patients with CLL using a 1 million high resolution SNP array. On 34 of them, sequential pre-treatment and relapse samples were available. The raw data was analysed using the OncoSNP analysis tool designed in-house specifically for cancer samples as it enables quantification of copy number alterations (CNA) and copy neutral loss of heterozygosity (cnLOH) based on B-allele frequency plots in complex mixtures. This allows low levels of aberrations to be detected and for mosaic samples to be identified. Results were compared against the data from the Wellcome Trust Case Control Consortium, the DGA and germline DNA in selected cases.
Large CNAs (>1Mb) and cnLOH (>5Mb) without deletions of 11q22.3 or 17p13.1 were identified in a third of patients. These patients had an intermediate clinical risk score that increased with the number of large CNAs. SNP array demonstrated clonal evolution in 32% of patients in the sequential sample cohort. These consisted of extension of the 13q abnormality (2), loss of the 13q deletion (1), a 10q23.1-q25.1 deletion (1), gain of 2pter-p14 (1), deletion of 2q33.1-q36.3, (1) a heterozygous deletion of 2q37.1 (1), gain of 8q22.2-qter (1), deletion of 8p (1), amplification of 8q (1), deletion of 8q (1), loss of 16p13.3 (2), mosaic deletion of 17q11.2 (1), an expansion of chromosomes carrying a 19p13.2-p13.11 gain and a 19p13.11 loss (1), deletions within 3p (1), conversion of a gain of 12p12.2-q21.31 to a copy neutral loss of heterozygosity (cnLOH) (1), deletion of 17pter-13.1 (1), increased proportion of chromosomes with the 7q33–34 deletion (1), expansion of cnLOH for 20q11.22-qter (1) and an increased number of cells with a deletion of 2q22.2-q24.1 (1) found at relapse. Importantly, most CNAs occurring at relapse were recurrent in the entire cohort implying that these are non-random events that are important in disease progression.
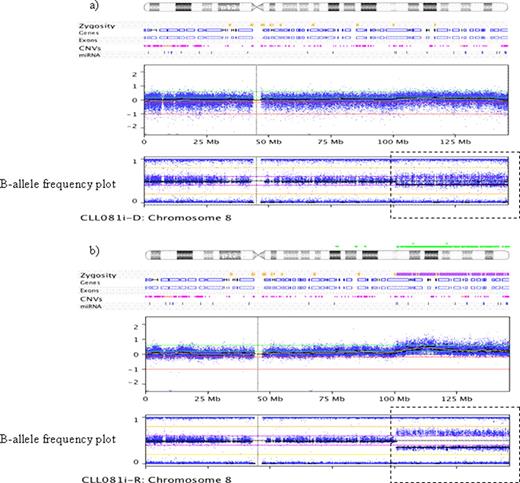
Analysis of the minimal deleted region (MDR) of these recurrent and relapse associated CNAs revealed genes important in lymphoid development, such as NFκB2 and TRAP1 found in the alternative NFκB pathway and BLIMP1 involved in B-cell differentiation. There were also recurrent abnormalities in the region coding for SP140 which has been implicated in familial CLL. Known cancer genes were also affected by these recurrent and relapse-associated CNAs such as RND3, RIF1, RFXANK, and RHOT1, which are all members of the RAS pathway family. Using the OncoSNP program it was possible to determine that most of these emerging abnormalities were present in low numbers at diagnosis (fig. 1) suggesting that treatment does not induce the genetic alterations but may select for them.
CNA and B-allele frequency plots of pre-treatment and relapse samples of a patient demonstrating clonal evolution. A low level of cnLOH can be seen in the B-allele frequency plot at diagnosis (a) at the end of chromosome 8 (dashed box) which becomes more apparent at relapse (b).
CNA and B-allele frequency plots of pre-treatment and relapse samples of a patient demonstrating clonal evolution. A low level of cnLOH can be seen in the B-allele frequency plot at diagnosis (a) at the end of chromosome 8 (dashed box) which becomes more apparent at relapse (b).
In conclusion, this is the first attempt to quantify CNAs in sequential leukaemia samples. The results demonstrate that recurrent and relapse associated CNAs affect genes important in B-cell development and cancer progression.
No relevant conflicts of interest to declare.
Author notes
Asterisk with author names denotes non-ASH members.


This feature is available to Subscribers Only
Sign In or Create an Account Close Modal