Abstract
Abstract 3124
The incidence of NHL increases exponentially with rising age. The most rapidly growing segment of the population is persons > age 65 years, especially > age 80. As a percentage of US population, the age group >80 years has increased by >250% from 1960 to 2000. Furthermore, persons >80 years will more than double within 20 years. However, little data is available regarding the characteristics or outcomes of very elderly NHL patients (pts).
We completed a multicenter retrospective analysis of very elderly NHL pts (=/> 80) diagnosed (dx) between 9/99-9/09 at 4 Chicago centers. Detailed pt and disease characteristics were collected including comorbidities, which were assessed using the Cumulative Illness Rating Scale for Geriatrics (CIRS-G). Pts were also classified if they were “fit” (i.e., preserved activities of daily living (ADLs), <3 grade 3 CIRS-G, no grade 4, and no geriatric syndrome: dementia, delirium, depression, incontinence, falls, neglect/abuse, or failure to thrive).
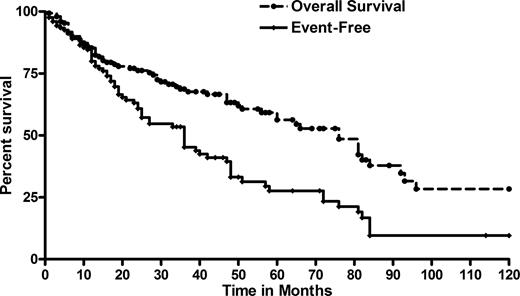
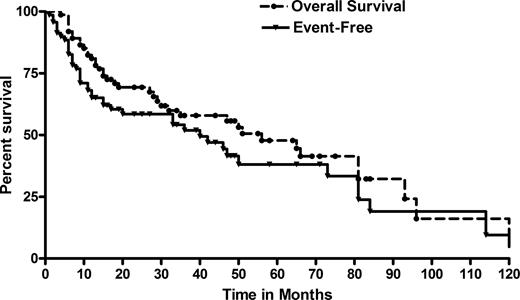
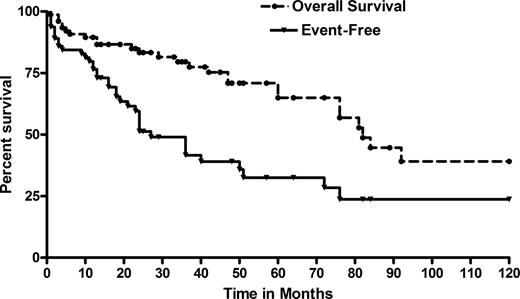
We identified 150 pts (F:M 1.14) with a median age of 84 years (80-96). 74 pts had aggressive NHL histology: DLBCL n=56 (systemic n=49, primary CNS n=5, gastric n=1, PEL n=1), T-cell n=11 (peripheral n=7, Sezary n=4) and MCL n=7. 76 pts had indolent NHL: follicular n=32, mycoses fungoides n=16, MZL n=17, CLL/SLL n=8 and lymphoplasmacytic n=4. Disease characteristics at dx included: B symptoms 20%, PS 2–3 18%, marrow involvement 35%, >1 extranodal 20%, elevated LDH 38%, anemia 41%, thrombocytopenia 16%, renal insufficiency 25%, and 36% had a history of coronary artery disease. Additionally, 28% had prior malignancy. Comorbidities were common; 77% of pts had a cumulative CIRS score >6, while 74% had a grade 3–4 CIRS-G in at least 1 category. Furthermore, 33% were classified as “not fit” at NHL dx, 12% had loss of ADLs, while 22% had a geriatric syndrome at time of NHL dx. 57% had stage III/IV disease. Pts with aggressive B cell histology received a rituximab (R)-containing regimen 85% of the time, while 84% of all aggressive NHL received at least one cycle with an anthracycline. Initial therapy for B cell indolent NHL were: observation (24%), R alone (35%), R-chemotherapy (CT) (31%), radiation (8%), and CT alone (2%). Among all pts, the overall response to first treatment was 68% (CR 49%). With 40-month median follow-up (1-120), 3-year EFS (event-free survival) and OS (overall survival) for all pts were 43.8% and 70.3%, respectively (stage I/II: EFS 49% and OS 81%; stage III/IV: EFS 42% and OS 65%; p=0.039 and p=0.09, respectively). Among aggressive NHL (n=74), 3-year EFS and OS were 55% and 64% (stage I/II: EFS 86% and OS 94%; stage III/IV: EFS 45% and OS 57%; p=0.0006 and p=0.03, respectively), while for indolent NHL (n=76), the 3-year EFS and OS were 34% and 77%, respectively (Figures 1–3). Prognostic factors predicting survival are shown in Table 1. In multivariate regression analyses, no response to initial therapy (i.e., SD/PD) predicted for significantly inferior EFS and OS (HR 5.45 [2.02-13.65], p=0.0007 and HR 6.88 [1.66-28.44], p=0.008, respectively).
Long-term survival of very elderly NHL was feasible with 64% and 77% 3-year OS for aggressive and indolent histologies, respectively. However, comorbidities as well as a designation of “unfit” portended a significantly inferior outcome in univariate models. Primary resistance to initial therapy occurred in 32% of pts and also predicted for poor prognosis. Given the rising incidence and prevalence of very elderly NHL, prospective examination of this subset of pts is strongly warranted.
Prognostic factors (univariate).*
| Factor . | EFS . | OS . | ||||
|---|---|---|---|---|---|---|
| . | HR . | 95%CI . | P . | HR . | 95%CI . | P . |
| Presence of diabetes | 0.73 | 0.55–0.98 | 0.03 | 0.81 | 0.55–1.17 | 0.26 |
| Low albumin | 1.53 | 0.87–2.71 | 0.14 | 2.49 | 1.26–4.95 | 0.009 |
| Presence of geriatric syndrome | 1.83 | 0.95–3.54 | 0.07 | 1.65 | 0.71–3.80 | 0.24 |
| Elevated LDH | 2.26 | 1.26–4.07 | 0.006 | 2.33 | 1.11–4.87 | 0.03 |
| Loss of ADLs | 2.86 | 1.46–5.61 | 0.002 | 3.88 | 1.79–8.42 | 0.0006 |
| No response to initial therapy (PD/SD vs CR/PR) | 3.14 | 1.82–5.39 | <0.0001 | 2.77 | 1.39–5.51 | 0.004 |
| Pt not “fit” | 3.28 | 1.74–6.17 | 0.0002 | 2.93 | 1.32–6.52 | 0.008 |
Twenty-two factors included in the univariate analysis; only factors with p <0.10 shown here.
HR, hazard ratio; CI, confidence interval; PD, progressive disease; SD, stable disease; CR, complete remission, PR, partial remission.
No relevant conflicts of interest to declare.
Author notes
Asterisk with author names denotes non-ASH members.


This feature is available to Subscribers Only
Sign In or Create an Account Close Modal