

Abstract
Abstract 2975
Skeletal complications including pathologic bone fractures, skeletal related plasmacytoma, bone pain and hypercalcemia are major clinical problems for patients with multiple myeloma (MM). Osteoclastgenesis are reportedly triggered by receptor activator of nuclear factor kappa β ligand (RANKL) and inhibited by osteoprotegerin (OPG). Since OPG is an inhibitor of RANKL, a possible role of TRAIL as an osteoclast inducer is suggested. We have previously reported that TRAIL was produced from myeloma cells and it correlated with skeletal-related events (SRE) at the 51th ASH meeting. In the present study, we analyzed a total of 56 cases with MM and examined their urine deoxypyridinorine (U-DPD) concentration, and the expression of DKK-1, MIP-1a by their MM cells, revealing that TRAIL is a powerful and independent predictor of SRE.
Myeloma cells were purified from bone marrow samples from 56 MM patients using CD138-immunomagnetic beads. Plasma cells from MGUS patients were also evaluated. All samples were obtained under informed consent according to Helsinki Declaration. TRAIL, DKK1 and MIP1a RNA expression in purified MM cells was analyzed using real time PCR. Serum concentrations of TRAIL from MM patients and healthy donors were determined with ELISA. We also examined concentrations of TRAIL in bone marrow plasma from MM and MGUS patients. MM patients were given Skeletal-Related Event Score (SRE score) according to skeletal complications and therapeutic events such as irradiation and operation. Osteoclasts were generated using peripheral blood mononuclear cells (PBMC), M-CSF, sRANK-L, and the murine pre-osteoclastic cell line RAW264.7. Numbers of viable osteoclasts and RAW264.7 cells were determined upon treatment with rTRAIL.
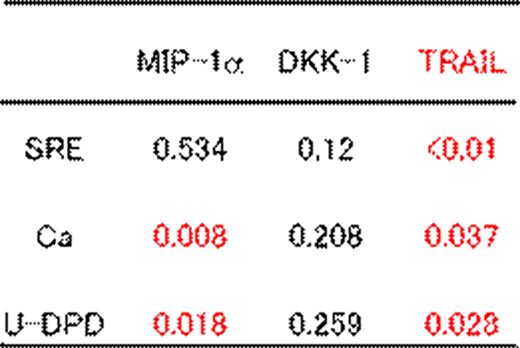
TRAIL expression in myeloma cells from MM patients was 5-fold greater than that in plasma cells from MGUS patients (p<0.01). No correlation was observed between TRAIL expression levels in myeloma cells and serum TRAIL concentrations. Serum TRAIL concentrations in healthy donors were not significantly different from those in MM patients. However, TRAIL expression levels in myeloma cells correlated to TRAIL concentrations in corresponding bone marrow plasma samples (p<0.05). Univariate analysis revealed that there was a significant correlation of TRAIL expression levels with serum calcium levels (p<0.05), U-DPD concentrations (p<0.05) and SRE scores (p<0.01). DKK1 expression levels in myeloma cells had no correlation with serum calcium (p=0.20), U-DPD (p=0.26), or SRE scores (p=0.12), while MIP1a expression levels correlated with serum calcium (p<0.01) and U-DPD (p<0.05) levels, but not with SRE scores (p=0.53). Summary of statistical analysis is shown in table 1. Although PBMC-derived osteoclasts constitutively expressed TRAIL receptors, DR4 and DR5, rTRAIL did not trigger apoptosis in osteoclasts or RAW264.7 cells.
We propose that MM patients with high TRAIL expression levels in MM cells tend to have greater chances of skeletal complications. Since serum TRAIL concentrations did not correlate with TRAIL RNA expression in myeloma cells, increase of TRAIL in bone marrow microenvironment should be important to develop bone destruction. TRAIL is an important predictable factor for SREs, serum calcium, and U-DPD. Since DKK-1 suppresses osteoblast differentiation rather than manipulating osteoclastgenesis, DKK1 expression may not be capable enough of reflecting SRE events. At this time, how MM cells survive from TRAIL expression, which is associated with apoptosis, is not known. We hypothesize that MM cells are protected by their adhesion to stromal cells as previously reported (J. Immunol. 180:1545-55, 2008), while osteoclasts may be directly activated by TRAIL. Since direct induction of apoptosis of osteoblast by TRAIL is also reported, taken our findings together, TRAIL may be a key molecule inducing SRE in MM patients. Our findings may introduce a new strategy targeting TRAIL to reduce skeletal events in MM.
Statistical analysis of three molecules produced from MM cells as indicators of SRE, serum calcium and urine DPD concentration. P values are shown.
No relevant conflicts of interest to declare.

This feature is available to Subscribers Only
Sign In or Create an Account Close Modal