Abstract
Abstract 2921
STAT3 and STAT5 regulate fundamental cellular processes and comprise the most studied signaling molecules of both normal and malignant hematopoiesis. Deregulation of STAT signaling contributes to leukemogenesis and may serve as a treatment target. In leukemic progenitors (LPs), the clustering of STAT3 and STAT5 phosphorylation patterns, both basal and after growth factor stimulation, can be achieved by flow cytometry, leading to the identification of distinct signaling profiles (SPs). In acute myeloid leukemia patients, SPs reflect the biological behavior of the LPs and can distinguish patient subgroups with worse prognosis and/or resistance to treatment. As epigenetic defects of genes involved in cell signaling are frequently observed in cancer cells we investigated the alterations in the SPs of MDS progenitors during azacytidine treatment and their correlation with response, cytogenetics and transfusion requirements.
Bone marrow samples of 24 high risk MDS patients were obtained before and 15 days after the initiation of azacytidine in order to assess potential changes in SP before the disappearance of the LPs. According to the IWG response criteria patients were divided into group A (CR, PR and HI, n=10) and group B (stable disease and failure, n=14). Immunomagnetically purified LPs were either left untreated or stimulated with G-CSF and GM-CSF for 15` and then stained intracellularly with monoclonal antibodies against STAT3 and STAT5.
The comparisons of basal and potentiated responses before and 15 days after azacytidine initiation were made with Mann-Whitney U-test. Clustering of SPs was performed with hierarchical cluster analysis and was correlated with treatment response, cytogenetics and transfusion dependence by using Chi square or Fisher Exact tests as appropriate. All analyses were performed using SPSS 14.0 software (SPSS Science, Chicago, IL).
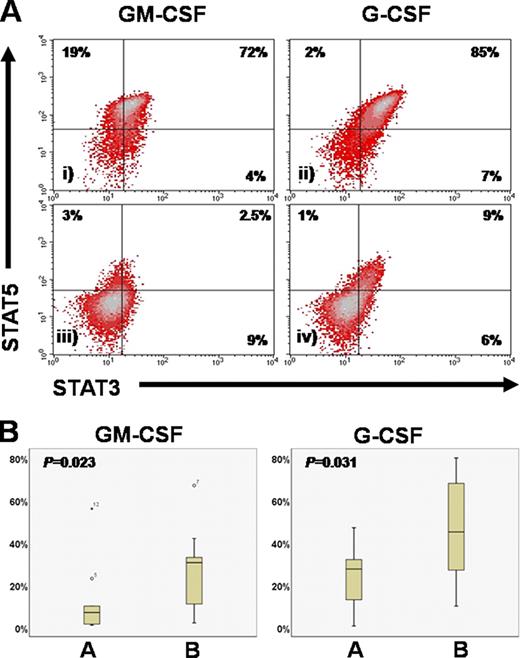
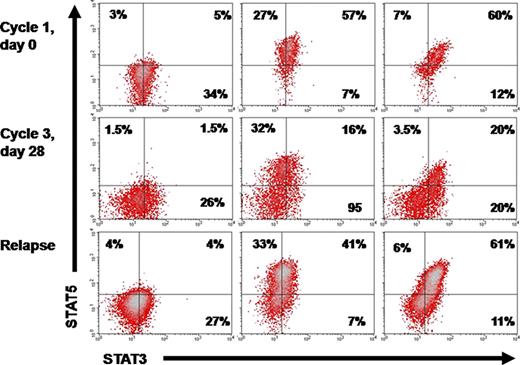
By clustering the SPs before and 15 days after the initiation of azacytidine we distinguished two subgroups of patients based on both the basal levels and potentiated response to growth factors. Patients with generally weak expression of STAT3 and STAT5 had significantly better response to azacytidine compared to those with strong expression of the same molecules (p=0.035), whereas there were no correlation of SPs with the karyotype (p=0.45) and transfusion rate (p=0.39). In line with the above, we further identified a STAT3+STAT5+ double positive population of MDS progenitors whose pretreatment levels after G-CSF and GM-CSF stimulation were inversely associated with treatment response (figure 1). Additionally, SP kinetics were following the disease course and response to therapy. In two late-stage MDS patients who achieved complete remission the SP was restored to early-stage MDS levels in day 15 after azacytidine initiation (figure 2A). In contrast, the SPs in the majority of non-responding patients remained unaltered (figure 2B), whereas the SP of a relapsing patient reverted to pretreatment levels after an initial restoration to early-stage MDS levels (figure 3).
Significantly lower pretreatment levels of STAT3+STAT5+ MDS progenitors after G and GM-CSF stimulation in responding patients.
(A) Representative plots of a patient who failed azacytidine (i, ii) and one who achieved CR (iii, iv). (B) Cumulative results in responding (A) and non-responding (B) patients.
The kinetics of SPs follow the response to azacytidine.
(A) The SP of a late-stage MDS patient who attained PR reverted to early-stage MDS levels at day 15 after the first cycle of azacytidine. (B) By contrast, a patient who failed treatment displayed no SP changes.
The kinetics of SPs follow the response to azacytidine.
(A) The SP of a late-stage MDS patient who attained PR reverted to early-stage MDS levels at day 15 after the first cycle of azacytidine. (B) By contrast, a patient who failed treatment displayed no SP changes.
Kinetics of the SP in a relapsing patient
Plots of a patient who achieved CR but relapsed 4 months after the discontinuation of azacytidine.
Kinetics of the SP in a relapsing patient
Plots of a patient who achieved CR but relapsed 4 months after the discontinuation of azacytidine.
In conclusion, we demonstrate that SP alterations of MDS progenitors during azacytidine treatment can predict clinical response. Moreover, it appears that azacytidine can restore the leukemic signaling in MDS by modifying both the basal and potentiated expression of STAT3 and STAT5. Our findings advocate the differentiating activity of hypomethylating agents, potentially via epigenetic reprogramming of pivotal signaling networks of leukemic progenitors.
No relevant conflicts of interest to declare.
Author notes
Asterisk with author names denotes non-ASH members.


This feature is available to Subscribers Only
Sign In or Create an Account Close Modal