Abstract
Abstract 2712
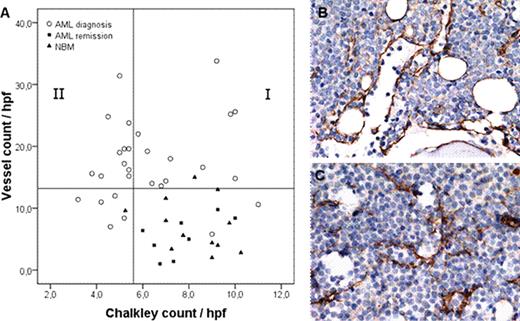
Acute Myeloid Leukemia (AML) bone marrow biopsies at diagnosis display an enhanced microvessel density (MVD), restoring to normal vessel counts when a complete remission has been achieved (de Bont et al, 2001; Padro et al, 2000). The enhanced MVD is correlated with increased expression of Vascular Endothelial Growth Factor (VEGFA), which is found to be a prognostic factor for therapeutic outcome in AML (de Bont et al, 2001, 2002; Aguayo et al, 1999). In the literature it has been described that the availability of VEGFA is related to different vascular morphology patterns in a xenograft mouse model (Lee et al., 2005). In this study we investigated the vascular morphology in AML bone marrow biopsies in relation to AML-derived VEGFA protein levels. Bone marrow biopsies (n=32) were stained for Factor VIII, a marker for Endothelial Cells, to enumerate the number of vessels. A significant (p<0.001) increased vessel count was demonstrated in AML at diagnosis compared with normal control bone marrow (NBM, n=14) and AML at remission (n=8). Based on the fact that >95% of the NBM and AML remission biopsies had a vessel count below 13 microvessels/hpf, this value was taken as cut-off point for categorization into ‘low vessel count’ (13 or less) and ‘high vessel count' (more than 13). A ‘high vessel count' was detected in 75% (24/32) of the AML bone marrow biopsies at diagnosis. Since vessel stabilization requires pericyte coverage of the vascular sprouts, we studied the number of vessels positive for Smooth Muscle Actin (SMA), a marker for pericytes. In AML bone marrow biopsies at diagnosis 35% of vessels were pericyte coated versus 55% of vessels in NBM and AML remission (p=0.02). Interestingly, the percentage vessels coated with pericytes was significantly (p=0.04) higher in the biopsies with a ‘low vessel count' (45%) compared with the biopsies showing a ‘high vessel count' (29%), indicating that a high vessel density in AML is related to a more immature vessel status. To quantify the vasculature morphology, the vessel count was combined with a method to measure the vessel surface area (Chalkley count; Sie et al., 2010) (Fig. 1A). Based on the Chalkley count the AML bone marrow biopsies at diagnosis with ‘high vessel count' could be divided into two groups with abnormal vessels. The first group (37.5%) had a normal Chalkley count (group I in Fig. 1A) and was defined as ‘vessel hyperplasia', characterized by vessels with a predominantly large lumen and thin walls (Fig 1B). The second group (37.5%) had a Chalkley count below normal (group II in Fig. 1A) and was defined as ‘angiogenic sprouting', displaying a network of small vessels with thin walls, narrow lumen and branching (Fig.1C). Moreover, we found that high blast VEGFA protein levels were significantly (p=0.007) higher in the ‘vessel hyperplasia' group compared with the other defined groups. In conclusion, our study shows that heterogeneity in AML bone marrow vasculature exists and can be quantified using vessel count in combination with Chalkley count. Furthermore, the VEGFA protein levels excreted by AML blasts are related to the defined vessel morphology patterns. Clinical trials targeting the VEGF/VEGFR signaling pathway in patients with relapsed or refractory AML showed beneficial effects in only a subset of patients (Karp et al, 2004). It might be that adapting therapeutic approaches to bone marrow morphology will improve treatment outcome. Ongoing work investigating the response of anti-VEGFA therapies related to AML bone marrow vasculature will have to confirm this hypothesis.
Morphology patterns in AML bone marrow biopsies. (A) Scatterplot representing the bone marrow vessel count and Chalkley count of AML at diagnosis, NBM and AML at remission. AML biopsies at diagnosis with a ‘low vessel count’ are displayed below the Y-axis reference line (13 microvessels/hpf), based on the fact that >95% of NBM and AML remission had a vessel count below 13 microvessels/hpf. The X-axis reference line divides AML biopsies at diagnosis with a ‘high vessel count' into two groups according to median Chalkley count of 5.4 in AML at diagnosis. The >95% Chalkley count of the NBM and AML remission biopsies sets an identical cut-off point. Group I, ‘vessel hyperplasia'>5.4; group II, ‘angiogenic sprouting' ≤5.4. Spearman's rho 0.15, p=0.42. (B) Representative picture of immunohistochemical staining for ‘vessel hyperplasia' and (C) ‘angiogenic sprouting'.
Morphology patterns in AML bone marrow biopsies. (A) Scatterplot representing the bone marrow vessel count and Chalkley count of AML at diagnosis, NBM and AML at remission. AML biopsies at diagnosis with a ‘low vessel count’ are displayed below the Y-axis reference line (13 microvessels/hpf), based on the fact that >95% of NBM and AML remission had a vessel count below 13 microvessels/hpf. The X-axis reference line divides AML biopsies at diagnosis with a ‘high vessel count' into two groups according to median Chalkley count of 5.4 in AML at diagnosis. The >95% Chalkley count of the NBM and AML remission biopsies sets an identical cut-off point. Group I, ‘vessel hyperplasia'>5.4; group II, ‘angiogenic sprouting' ≤5.4. Spearman's rho 0.15, p=0.42. (B) Representative picture of immunohistochemical staining for ‘vessel hyperplasia' and (C) ‘angiogenic sprouting'.
No relevant conflicts of interest to declare.
Author notes
Asterisk with author names denotes non-ASH members.


This feature is available to Subscribers Only
Sign In or Create an Account Close Modal