Abstract
Abstract 2646
Chronic transfusions are the only treatment validated to reduce the stroke risk in children with SCD whose velocity at transcranial doppler (TCD) is ≥ 200 cm/sec. This treatment has potential risks and its optimal duration is not known. In order to evaluate the potential role of HU for primary stroke prevention, we reviewed the time-averaged maximum velocities (TAMV) measured by TCD in the middle cerebral arteries and the magnetic resonance angiographies (MRA) of SCD patients aged from 1 to 25 years and followed in our institution between 1993 and 2008.
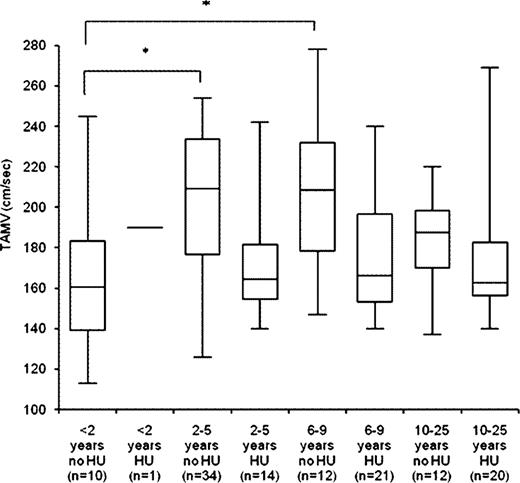
In 124 patients (65 females and 59 males) screened by TCD for the first time at a mean age of 7.1±5.3 years, we found that in patients not treated by HU at the time of first TCD (n=68), the TAMV was higher in patients aged from 2 to 5 years (203±37 cm/sec, n= 34, p<0.01) and from 6 to 9 years (207±36 cm/sec, n = 12, p=0.01) compared to patients less than 2 years of age (163±37 cm/sec, n = 10) and older than 9 years of age. This change of TAMV was statistically significant between age groups in patients not treated by HU at the time of first TCD (n=68) but not in patients already on HU therapy at the time of first TCD (n=56) (Fig 1) who had significant lower velocities.
Among those 124 patients, 98 were evaluated by repeated TCD with a mean follow-up of 47±27 months (9 were lost to follow-up, 13 had no acoustic window, 3 were treated by allogeneic HSCT and one developed AML).
In those 98 patients, 41 were treated by HU at the time of first TCD and 57 were not. In patients without HU, the TAMV increased in patients with normal first TCD (144±15 cm/sec to 157±17 cm/sec, n=15, p=0.04), stabilized in patients with conditional first TCD (181±8 cm/sec to 177±24 cm/sec, n=16, p=0.45) and decreased in patients with abnormal first TCD and who were thereafter treated by HU between the first and last TCD (229±11 cm/sec to 199±21 cm/sec, n=26, p<0.01). In comparison, in patients on HU at the time of first TCD (n=41), the TAMV stabilized in patients with normal first TCD (154±9 cm/sec to 158±17 cm/sec, n=22, p=0.29) and in patients with conditional first TCD (181±6 cm/sec to 181±25 cm/sec, n=12, p=0.85), but decreased in patients with abnormal first TCD and who were already on HU (224±13 cm/sec to 192±12 cm/sec, n=7, p=0.02). Until the late nineties, chronic transfusion programmes for abnormal TCD were not feasible in our institution because of the high rate of allo-immunisations mainly due to few African blood donors with correct matching of blood products and inadequate blood transfusion policy.
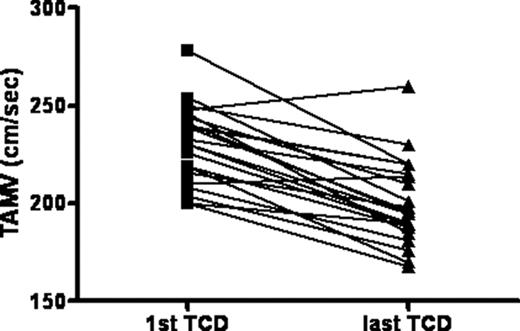
From the 27 patients who started HU for an abnormal TCD, 25 repeated TCD (one patient was lost to follow-up and one treated by allogeneic HSCT) and from those 25, 3 had no more acoustic window. The mean TAMV of these 22 evaluable patients (mean age of 5.0±3.0 years) dropped from 231±20 cm/sec to 200±22 cm/sec (p<0.01) after a mean follow-up of 48±29 months at last TCD (Figure 2). The MRA performed in the 25 patients who repeated TCD showed a stenosis in 8 of them (32%). No stroke was recorded in those 25 patients for a follow-up of 99 patient-years and none of these patients received HU at the maximum tolerated dose (MTD) (mean dose of 22±3 mg/kg/day).
The incidence of first stroke in our entire cohort was 0.48 for 100 patient-years, lower than in patients of other larger cohorts (0.61 per 100 patient-years in the patients of the CSSCD) and similar to another cohort treated by HU (0.52 per 100 patient-years) (Zimmerman SA et al, Blood 2007).
In conclusion, HU might be an effective and simpler alternative to chronic transfusions in some children with SCD and abnormal TCD, although the effect of HU in primary stroke prevention in SCD children has still to be validated by controlled trials.
Distribution of the time-averaged maximum velocity (TAMV) according to age group and treatment by HU at the time of first TCD. Data shown as a box plot with median, 1st and 3rd quartiles, min. and max. (* p < 0.05, using non parametric test).
Distribution of the time-averaged maximum velocity (TAMV) according to age group and treatment by HU at the time of first TCD. Data shown as a box plot with median, 1st and 3rd quartiles, min. and max. (* p < 0.05, using non parametric test).
Changes of TAMV in 22 patients treated by HU for an abnormal TCD (TAMV ≥ 200 cm/sec) after a mean follow-up of 48±29 months at the time of last TCD.
Changes of TAMV in 22 patients treated by HU for an abnormal TCD (TAMV ≥ 200 cm/sec) after a mean follow-up of 48±29 months at the time of last TCD.
No relevant conflicts of interest to declare.
Author notes
Asterisk with author names denotes non-ASH members.


This feature is available to Subscribers Only
Sign In or Create an Account Close Modal