Abstract
Abstract 1887
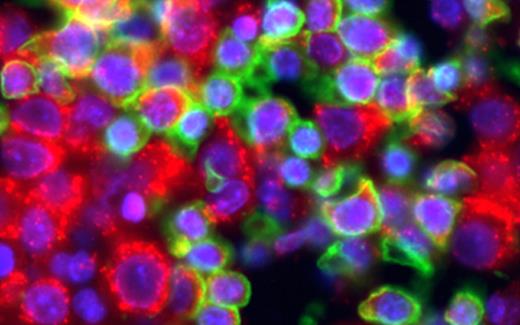
Myelodysplastic syndromes (MDS) are clonal bone marrow failure disorders with variably progressive bone marrow failure and risk of leukemic transformation. Risk stratification based on the International Prognostic Scoring System (IPSS) is a powerful tool, but much clinical variability remains within risk categories. Gene expression profiling (GEP) of disaggregated bone marrow mononuclear cells has yielded many potential prognostic biomarkers; such studies are limited by (1) the need for fresh bone marrow and labor-intensive analysis of individual specimens, leading to a bottleneck between identification of biomarkers and clinical implementation, and (2) by the loss of cell-specific and architectural information. We have demonstrated the feasibility of quantitative cell-type-specific evaluation of biomarkers in intact archival MDS bone marrow (BM). Routinely processed archival core biopsy specimens were sampled to create tissue microarrays (TMAs). We chose to test the protein products of 4 genes overexpressed in a “poor risk” gene signature for early leukemic transformation in MDS (Sridhar K et al, Blood 114:4847, 2009). These include ribosomal subunit components RPS4 and RPL23 and proteases TPP2 and KLK3. A TMA was constructed from 1 mm cores of 5 normal, 4 MDS, and 5 acute myeloid leukemia (AML) BM core biopsies. Immunohistochemistry showed reproducible cytoplasmic staining of immature mononuclear cells by antibodies against RPL23, RPS4Y, TPP2, and KLK3; TPP2 also stained megakaryocytes. Reactivity with a correctly-sized band was confirmed by Western blotting of frozen BM from normal and MDS subjects. Double immunofluorescence (IF) staining was then performed to allow simultaneous identification of cell types of interest [CD34+ progenitors, Glycophorin C(GPC)+ erythroid precursors] in combination with quantitative analysis of the marker of interest. Representative image Figure 1: ribosomal marker RPL23 (red) and erythroid marker GPC (green); DAPI nuclei (blue):
After scanning of the TMA on the Ariol platform, CellProfiler image analysis software (Broad Institute) was used to identify primary objects (nuclei) in the DAPI stained-image, and associated secondary objects (cells) in the green channel; fluorescence intensity was then quantified in the red channel. An example of object identification in CellProfiler is shown in Figure 2:
Primary objects (red outline) Secondary objects – CD34+ (red outline)
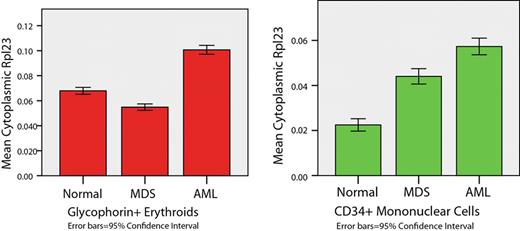
When the mean per cell intensities from pooled MDS specimens were compared with the pooled normal specimens, all four putative “poor prognosis” biomarkers were significantly more highly expressed in the CD34+ population of MDS as compared to normal BM; even higher expression was seen in AML (see table below; Kruskal Wallis test with Bonferroni adjustment for multiple comparisons, p<0.001 for all comparisons except no significant difference in RPL23 between MDS and AML). These results are consistent with the prior GEP data performed on isolated CD34+ progenitors. By contrast, GPC+ erythroid precursors in MDS showed significantly lower expression of RPL23, RPS4 and TPP2 in MDS compared to normal BM (See Table 1and Figure 3, below). KLK3 was overexpressed in the MDS erythroid compartment (p<0.001 for all comparisons except RPS4 for normal versus MDS, p=0.042). These data demonstrate the ability to localize and quantitatively detect specific gene products in intact archival BM using IF-stained TMAs in conjunction with image analysis. Differential expression of these gene products was shown in CD34+ versus erythroid precursors. In addition, preliminary independent confirmation of a poor risk gene expression signature in CD34+ cells for MDS was demonstrated.
| . | . | CD34+ cells . | GPC+ erythroid cells . | ||||
|---|---|---|---|---|---|---|---|
| . | Normal . | MDS . | AML . | Normal . | MDS . | AML . | |
| KLK3 | N | 1277 | 1390 | 2676 | 4640 | 3084 | 5111 |
| Mean | .040 | .050 | .067 | .016 | .042 | .049 | |
| Std Dev | .066 | .077 | .078 | .031 | .072 | .061 | |
| RPS4 | N | 3022 | 2366 | 2614 | 2441 | 1139 | 1954 |
| Mean | .040 | .052 | .136 | .100 | .082 | .152 | |
| Std Dev | .067 | .060 | .137 | .125 | .098 | .14 | |
| RPL23 | N | 985 | 1193 | 2087 | 4533 | 3666 | 4175 |
| Mean | .022 | .044 | .057 | .068 | .055 | .101 | |
| Std Dev | .044 | .060 | .086 | .095 | .079 | .117 | |
| TPP2 | N | 1451 | 1590 | 1973 | 7497 | 8183 | 8639 |
| Mean | .034 | .060 | .096 | .078 | .053 | .101 | |
| Std Dev | .064 | .077 | .090 | .096 | .082 | .106 | |
N= Total number of cells analyzed.
Example of differential expression of ribosomal proteins – increased in CD34+ cells, but decreased in erythroid precursors, in MDS as compared to normal
Example of differential expression of ribosomal proteins – increased in CD34+ cells, but decreased in erythroid precursors, in MDS as compared to normal
No relevant conflicts of interest to declare.
Author notes
Asterisk with author names denotes non-ASH members.


This feature is available to Subscribers Only
Sign In or Create an Account Close Modal