Abstract
The Nijmegen breakage syndrome (NBS) is a rare inherited condition, characterized by microcephaly, radiation hypersensitivity, chromosomal instability, an increased incidence of (mostly) lymphoid malignancies, and immunodeficiency. NBS is caused by hypomorphic mutations in the NBN gene (8q21). The NBN protein is a subunit of the MRN (Mre11-Rad50-NBN) nuclear protein complex, which associates with double-strand breaks. The immunodeficiency in NBS patients can partly be explained by strongly reduced absolute numbers of B lymphocytes and T lymphocytes. We show that NBS patients have a disturbed precursor B-cell differentiation pattern and significant disturbances in the resolution of recombination activating gene-induced IGH breaks. However, the composition of the junctional regions as well as the gene segment usage of the reduced number of successful immunoglobulin gene rearrangements were highly similar to healthy controls. This indicates that the NBN defect leads to a quantitative defect in V(D)J recombination through loss of juxtaposition of recombination activating gene-induced DNA ends. The resulting reduction in bone marrow B-cell efflux appeared to be partly compensated by significantly increased proliferation of mature B cells. Based on these observations, we conclude that the quantitative defect will affect the B-cell receptor repertoire, thus contributing to the observed immunodeficiency in NBS patients.
Introduction
The Nijmegen breakage syndrome (NBS) is an inherited genetic disorder, which belongs to the group of chromosome instability syndromes. The clinical features are a characteristic facial appearance, microcephaly, growth retardation, immunodeficiency, and a strong predisposition to malignancies, especially of lymphoid origin.1-4 Cells of NBS patients are sensitive to ionizing radiation, and they have elevated levels of spontaneous chromosome aberrations and increased telomeric loss, which leads to chromosome instability.5 NBS patients have a mutation in the NBN gene on chromosome 8q21 (previous name: NBS1), which codes for the NBN protein.6 More than 90% of the patients have a homozygous 5-nucleotide deletion (c.657del5) presumed to be of Slavic origin (founder effect), which causes premature termination at codon 219.7 This hypomorphic mutation leads to expression of a 26-kDa N-terminal protein fragment and a 70-kDa fragment lacking the native N-terminus by internal translation initiation.8 The latter protein p70 retains in association with the MRE11 complex.
NBN forms a nuclear complex with MRE11 and RAD50 (ie, the MRN complex).9 This complex plays a role in repair of DNA double-strand breaks (DSBs). DSBs arise from ionizing radiation, oxidizing agents, but also occur physiologically during DNA replication, meiotic recombination, and V(D)J and class switching recombination.10 There are 2 pathways for DNA DSB repair: homologous recombination, which makes use of the sister chromatid as a template and operates during S or G2 phase; and nonhomologous end joining, which directly joins DNA ends without template and is active throughout the cell cycle.11 The MRN complex acts as a marker of DNA breaks and is probably involved in both pathways.12 It is activated in response to DSBs and keeps the 2 DNA ends in close proximity.13 RAD50 has a very long flexible arm, and an RAD50 dimer might hold DNA ends together in conjunction with 2 MRE11 molecules and an NBN molecule. Scanning force microscopy confirmed that juxtaposition of DNA ends indeed occurs through MRN interactions.14,15 In addition, the MRN complex has been shown to accumulate in large nuclear foci within minutes after DSB formation.16 This suggests that the MRN complex might form, probably with other proteins, a “sticky ball” that holds together the DNA ends, allowing some degree of freedom for movement of DNA ends and access of DNA repair proteins.17
A second function of the MRN complex is ATM activation. ATM is a key mediator of cellular response to DNA damage and exists as an inactive dimer in undamaged cells. MRN recruits ATM to DNA breaks, which results in dissociation of the ATM dimer enabling ATM activity.18 ATM phosphorylates many targets involved in regulation of cellular checkpoint response and DNA damage repair.19 One of the primary targets of ATM is histone H2AX. Histone modification spreads around the DSB, thereby marking the damaged site.10 H2AX phosphorylation facilitates recruitment and retention of several cell-cycle checkpoint proteins and DNA repair proteins, which allows stopping of cell-cycle progression and initiation of DSB repair. Cells lacking NBN continue DNA replication despite the presence of radiation-induced DSBs resulting from defective intra-S-phase checkpoint control, which is referred to as radio-resistant DNA synthesis. Finally, the MRN complex plays a role in maintenance of chromosomal integrity in the cell.20
One of the main clinical features of NBS patients is immunodeficiency, which can partly be explained by strongly reduced absolute numbers of B lymphocytes and T lymphocytes in peripheral blood. Such reduction of peripheral B lymphocytes and T lymphocytes might be the result of reduced production because of a defect in differentiation. V(D)J recombination takes place in differentiating B and T cells and rearranges the immunoglobulin (Ig) and T-cell receptor loci to create a diverse repertoire of B- and T-cell receptors. The first step in this process is lymphoid specific (ie, introduction of DSBs by the recombination activating genes, RAG1 and RAG2, resulting in the generation of hairpin-sealed coding ends and blunt signal ends). The second step is processing and ligation of the generated breaks by the general nonhomologous end-joining pathway.17 NBN has been shown in foci colocalizing with the T-cell receptor-α (TCRA) locus in developing thymocytes undergoing V(D)J recombination.21 Based on this finding, it was hypothesized that NBS patients might have a defect in V(D)J recombination explaining the reduced numbers of peripheral B lymphocytes and T lymphocytes. Extensive analysis of Ig rearrangements obtained from peripheral B lymphocytes of NBS patients did not show differences in the lengths and composition of the junctional region of the Ig kappa (IGK) and Ig heavy (IGH) chain gene rearrangements between NBS patients and healthy controls.22,23 Consequently, the investigators concluded that NBS patients have no defective V(D)J recombination. However, analysis of junctional regions in peripheral B cells does not fully exclude the possibility of a V(D)J recombination defect during precursor B- and T-cell differentiation. To address this issue, bone marrow samples of 18 NBS patients were analyzed to study the influence of an NBN defect on precursor B-cell differentiation and V(D)J recombination in precursor B cells.
Methods
Patients
In this study, 18 genetically defined NBS patients were studied with a mean age of 8.2 years (range, 10 months to 28 years). All patients carried the c.657del5 mutation in the NBN gene. Peripheral blood and bone marrow samples were obtained according to the guidelines of the local Medical Ethics Committee in accordance with the Declaration of Helsinki. The study was approved by the Children's Memorial Health Institute Institutional Review Board.
Flow cytometric analysis of peripheral blood and bone marrow
Absolute numbers of B, T, and NK cells were determined in peripheral blood samples. Flow cytometric immunophenotyping of bone marrow was focused on analyzing the composition of the precursor B-cell compartment. For this purpose, 50-μL aliquots of bone marrow mononuclear cells (10 × 106/mL) were used in each of the 12 four-color labelings as previously described.24 As reference samples, bone marrow samples of 31 healthy controls, 14 X-linked agammaglobulinemia (XLA) patients, and 17 RAG-deficient severe combined immunodeficiency (SCID) patients were analyzed that have partly been reported previously.24,25
Analysis of Ig gene rearrangements in bone marrow
DNA was isolated from bone marrow mononuclear cells. For analysis of coding joints, incomplete (DH-JH) or complete (VH-JH) IGH gene rearrangements were amplified by polymerase chain reaction (PCR) as previously described.26,27 In each 50-μL reaction, 50 ng of DNA, 5 pmol 5′ and 3′ primers, and 1 U of AmpliTaq Gold polymerase (Applied Biosystems) were used. PCR products were cloned in pGEM-Teasy (Promega) before sequencing with BigDye terminator mix (Applied Biosystems) using 3.3 to 6 pmol sequencing primers. Sequencing was performed on an ABI3130xl fluorescent sequencer (Applied Biosystems). Sequences were analyzed using IMGT software (http://imgt.cines.fr/).
IGH FISH on sorted (precursor) B-cell subsets
From bone marrow samples of NBS patients, pre–B-I cells (CD19+CD34+CD10+CD20−IgM−) were sorted with a FACSDigital Vantage (DiVa) cell sorter (BD Biosciences) after 5-color staining with CD34–fluorescein isothiocyanate (8G12), CD19–peridinin chlorophyll protein (SJ25C1), CD10-allophycocyanin (HI10a), CD20-allophycocyanin-Cy7 (Leu-16; BD Biosciences) and IgM-RPE (ITK Diagnostics). Mature B cells were sorted from bone marrow or peripheral blood based on CD19 expression (CD19+CD34−CD10−CD20+IgM+). Per subset, 40 000 cells were applied on a slide using cytocentrifugation28 and air-dried. The cells were hybridized with IGH fluorescence in situ hybridization (FISH) DNA Split Signal Probe set (Dako Denmark A/S) consisting of a fluorescein-labeled DNA probe (IGH-Flu) binding to a 612-kb segment in the IGH V region and a Texas Red-labeled DNA probe (IGH-TR) binding to a 460-kb segment in the IGH constant region. The principle of split-signal FISH is based on the presence of 2 colocalized (red/green) signals in the normal situation and a split of signals (separate red and green) in case of a chromosome break or translocation.29,30 The FISH procedure was performed using the Cytology FISH Accessory Kit (Dako Denmark A/S) according to the manufacturer's instruction. For each slide, 100 to 200 cells were analyzed with a fluorescent microscope (Zeiss Axioplan 2), and the number of cells in which probes were showing a split was calculated.
KREC assay to determine the replication history of B cells
The replication history of B cells was determined using the KREC assay, which is based on a quantification of coding joints and signal joints of an Ig κ-deleting rearrangement (intron RSS-Kde) by real-time quantitative PCR.31 The ΔCT between the signal joint and the coding joint exactly represents the proliferation history (ie, the number of cell divisions a B cell has undergone since leaving the precursor B-cell compartment).31 The real-time quantitative PCR mixture of 25 μL contained TaqMan Universal MasterMix (Applied Biosystems), 900nM of each primer, 100nM FAM-TAMRA-labeled probe, 25 ng of DNA, and 0.4 ng of bovine serum albumin, and was run on the ABIPRISM 7700 detection system (Applied Biosystems).31
Statistical analysis
Differences in precursor B-cell subset populations were analyzed using the nonparametric Mann-Whitney U test (one-tailed; P < .05 considered significant) in the GraphPad Prism program (GraphPad Software Version 5.02). Linear regression was used to analyze the relationship between size of a specific precursor B-cell subset and age. An unpaired t test was used for analyzing the differences in frequency of split signals in mature B cells as determined with IGH FISH (P < .05 considered significant).
Results
Decreased absolute numbers of peripheral B lymphocytes and T lymphocytes
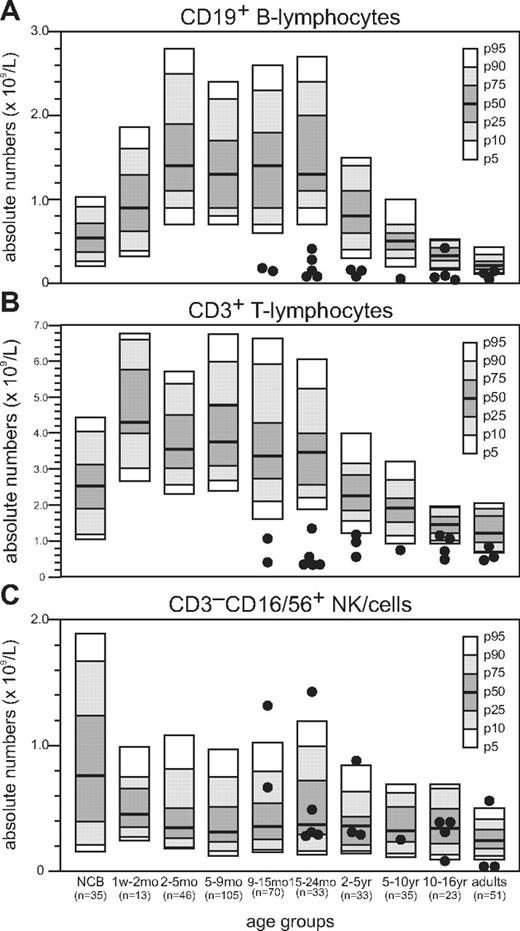
Absolute numbers of B lymphocytes and T lymphocytes in peripheral blood of NBS patients were reduced compared with healthy age-matched controls (Figure 1A-B).32 Below the age of 2 years, the absolute number of B lymphocytes was more than 4-fold below the 5th percentile; but with increasing age, the fold reduction became less apparent (Table 1). Above the age of18 years, they even reached low normal levels. In addition, for the absolute number of T lymphocytes, the fold reduction relative to the 5th percentile of normal was high below the age of 2 years but rapidly declined above the age of 2 years and even reached low normal values in 5 of the 11 NBS patients. In the majority of NBS patients, the absolute number of NK cells remained within the normal range (Figure 1C).
Absolute number of peripheral blood lymphocytes in NBS patients. Flow cytometric analysis of peripheral blood lymphocyte subsets of 18 NBS patients. Absolute numbers of B lymphocytes (A), T lymphocytes (B), and NK cells (C) are shown.
Absolute number of peripheral blood lymphocytes in NBS patients. Flow cytometric analysis of peripheral blood lymphocyte subsets of 18 NBS patients. Absolute numbers of B lymphocytes (A), T lymphocytes (B), and NK cells (C) are shown.
Fold reduction of B lymphocytes and T lymphocytes in NBS patients relative to the 5th percentile of healthy controls
| NBS patients per age group . | Fold reduction in number of B lymphocytes . | Fold reduction in number of T lymphocytes . |
|---|---|---|
| Less than 2 y (n = 7) | 4.4 | 3.3 |
| 2-5 y (n = 3) | 1.7 | 1.1 |
| 5-16 y (n = 5) | 2.9 | 1.1 |
| More than 16 y (n = 3) | 1.2 | 1.2 |
| NBS patients per age group . | Fold reduction in number of B lymphocytes . | Fold reduction in number of T lymphocytes . |
|---|---|---|
| Less than 2 y (n = 7) | 4.4 | 3.3 |
| 2-5 y (n = 3) | 1.7 | 1.1 |
| 5-16 y (n = 5) | 2.9 | 1.1 |
| More than 16 y (n = 3) | 1.2 | 1.2 |
Shifted composition of precursor B-cell compartment of NBS patients
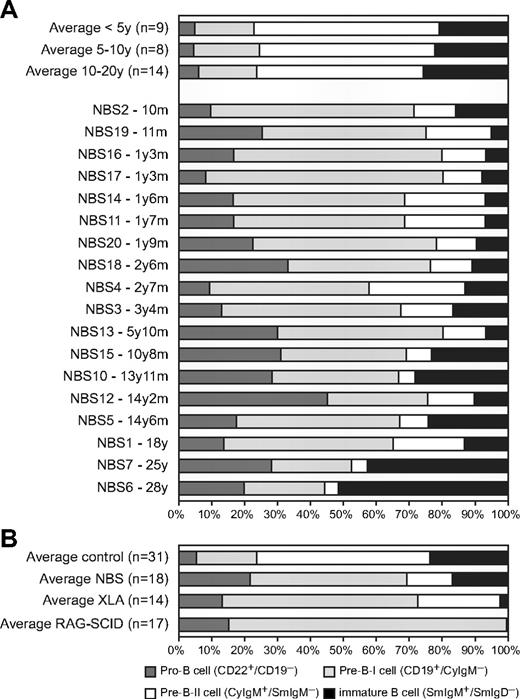
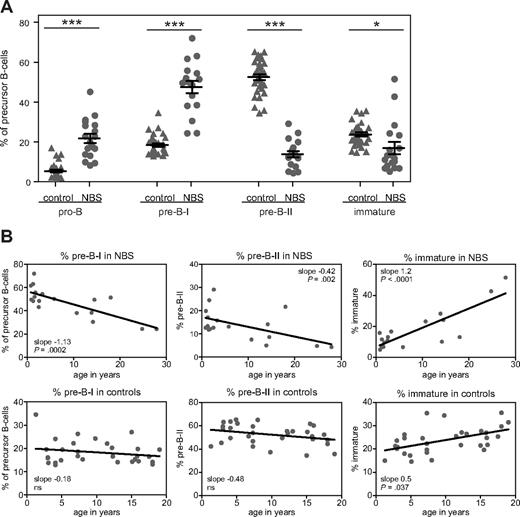
The composition of the precursor B-cell compartment in bone marrow of 18 NBS patients was determined using flow cytometric immunophenotyping (Figure 2A). Mature IgM+IgD+ B cells were excluded from calculation because they are assumed to be mainly the result of peripheral blood contamination in the bone marrow sample. The patterns were compared with those of 31 healthy controls. The composition of the precursor B-cell compartment of NBS patients showed a shifted pattern compared with healthy controls (Figure 2B). The percentages of pro-B and pre-B-I cells were significantly increased, whereas the percentages of pre-B-II and immature B cells were significantly decreased (Figure 3A). Furthermore, with increasing age, significant changes in the relative composition of the precursor B-cell subsets were observed in NBS patients (Figure 3B). A significant decrease was observed in the percentage of pre-B-I and pre-B-II cells in NBS patients, which was not paralleled by a similar decrease in the healthy controls. In addition, a highly significant increase in the immature B cells was found. Especially in the 2 oldest NBS patients (25 and 28 years of age), the percentage of immature B cells was more than 40% of the total precursor B-cell compartment. In addition, in healthy controls, a significant increase in immature B cells was observed, but this increase was not as strong as observed in NBS patients. Together, these findings demonstrate that NBS patients have a disturbed precursor B-cell differentiation, which is characterized by increased pro-B and pre-B-I cells in combination with a strong reduction in the pre-B-II cells and a milder reduction in the immature B-cell fraction that disappears on aging.
Precursor B-cell differentiation patterns of healthy donors, NBS, XLA, and RAG-deficient SCID patients. (A) Flow cytometric analysis of the precursor B-cell compartment in bone marrow of 31 healthy donors and 18 NBS patients. (B) The average precursor B-cell differentiation pattern of the 18 NBS patients was compared with the average patterns of 14 XLA patients and 17 RAG-deficient SCID patients and the 31 controls. All 3 patterns showed a block before the pre-B-II cell stage; however, only in RAG-deficient SCID patients was this block complete. In NBS and XLA patients, the block was incomplete (“leaky”), but the percentage of immature B cells was much lower in XLA than in NBS.
Precursor B-cell differentiation patterns of healthy donors, NBS, XLA, and RAG-deficient SCID patients. (A) Flow cytometric analysis of the precursor B-cell compartment in bone marrow of 31 healthy donors and 18 NBS patients. (B) The average precursor B-cell differentiation pattern of the 18 NBS patients was compared with the average patterns of 14 XLA patients and 17 RAG-deficient SCID patients and the 31 controls. All 3 patterns showed a block before the pre-B-II cell stage; however, only in RAG-deficient SCID patients was this block complete. In NBS and XLA patients, the block was incomplete (“leaky”), but the percentage of immature B cells was much lower in XLA than in NBS.
Age-dependent changes in the relative sizes of the precursor B-cell subsets. (A) The relative size of the precursor B-cell subsets (given in percentages) was statistically significant different from healthy controls: *P < .01, ***P < .001 by nonparametric t test. (B) Statistically significant age-dependent increases or decreases were observed in the percentage pre-B-I, pre-B-II, and immature B cells of NBS patients. In healthy controls, only a statistically significant age-dependent increase was observed in the percentage immature B cells.
Age-dependent changes in the relative sizes of the precursor B-cell subsets. (A) The relative size of the precursor B-cell subsets (given in percentages) was statistically significant different from healthy controls: *P < .01, ***P < .001 by nonparametric t test. (B) Statistically significant age-dependent increases or decreases were observed in the percentage pre-B-I, pre-B-II, and immature B cells of NBS patients. In healthy controls, only a statistically significant age-dependent increase was observed in the percentage immature B cells.
NBS B-cell patterns markedly differ from patterns of XLA patients and RAG-deficient SCID patients
Disturbed precursor B-cell differentiation is also observed in patients with agammaglobulinemia and T-B-SCID. Most of the agammaglobulinemia patients have the X-linked form (XLA) caused by a mutation in the BTK gene. XLA patients have a defect in pre-B-cell receptor (pre-BCR) signaling resulting in an incomplete (or “leaky”) block in precursor B-cell differentiation before the cytoplasmic Igμ-positive pre-B-II cell stage (Figure 2B).25 The immature B-cell fraction is strongly reduced, and mature B cells are hardly detectable in blood and bone marrow. RAG-deficient SCID patients have a defect in V(D)J recombination of Ig and T-cell receptor genes resulting in a complete absence of B lymphocytes and T lymphocytes. As V(D)J recombination is initiated during the pre-B-I cell stage, the precursor B-cell differentiation is completely blocked in this stage (Figure 2B).24,33
Although the precursor B-cell differentiation in NBS patients also seemed to be blocked before the pre-B-II cell stage, the disturbance is markedly different. First, the block is not as complete as observed in XLA with a pre-BCR signaling defect and RAG-deficient SCID patients with a V(D)J recombination defect because the percentage of immature B cells is only mildly decreased at young age. Second, mature B cells are present in bone marrow of NBS patients in contrast to bone marrow of XLA and RAG-deficient SCID patients (data not shown). The percentage of mature B cells in bone marrow was on average even higher than found in healthy controls (46% vs 33%). Taken together, our data reveal that NBS patients have a disturbed precursor B-cell differentiation pattern in combination with the presence of mature B cells that markedly differs from patterns of patients with a pre-BCR signaling defect or a complete V(D)J recombination defect.
Replication history of bone marrow–derived B-cell subsets
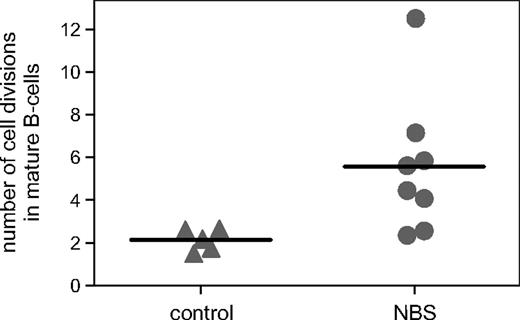
Although mature B cells were clearly detectable in bone marrow of NBS patients, the absolute numbers of peripheral B cells were reduced. Therefore, we studied the replication history of the bone marrow–derived B-cell subsets using the KREC assay, which is based on the ratio between the signal and coding joints of a specific rearrangement at the IGK locus (Intron RSS-Kde).31,34 As expected, pre-B-I and pre-B-II cells did not show proliferation with this assay (number of cell divisions < 1) similar to healthy controls. However, mature B cells, which are assumed to represent peripheral B cells, showed an increased number of cell divisions of 5.6 on average (range, 2.4-12.5) compared with controls (Figure 4). This significant difference was not caused by a difference in the composition of peripheral blood naive and memory B cells because this appeared similar (A.W.L., M.v.d.B., J.J.M.v.D., K.H.C., manuscript in preparation). These results show that mature B cells of NBS patients have undergone an increased number of cell divisions, but that despite this increased proliferation, the absolute number of peripheral B cells is clearly reduced.
Replication history of mature B cells. The number of cell divisions was determined in sorted mature B cells using the KREC assay. The number of cell divisions was statistically significantly (P = .02) increased in NBS patients (n = 8) compared with healthy age-matched controls (n = 5).
Replication history of mature B cells. The number of cell divisions was determined in sorted mature B cells using the KREC assay. The number of cell divisions was statistically significantly (P = .02) increased in NBS patients (n = 8) compared with healthy age-matched controls (n = 5).
Normal composition of DH-JH coding joints in bone marrow
The precursor B-cell differentiation pattern in NBS patients was not suggestive of a severe V(D)J recombination defect; however, the bone marrow immunophenotyping did not exclude a mild V(D)J recombination defect. Therefore, the composition of the coding joints of rearranged IGH genes was studied in detail in bone marrow mononuclear cells. Analysis of the composition of junctional regions of incomplete IGH gene rearrangements (ie, DH-JH gene rearrangements) of 10 NBS patients did not differ from rearrangements obtained from 5 healthy donors (Table 2). The average number of deleted nucleotides per junction resulting from exonuclease activity as well as the number of randomly inserted nontemplated (N) nucleotides by TdT and the number of palindromic (P) nucleotides did not differ significantly from that observed in the control junctions. In conclusion, these data show that the composition of the junctional regions of incomplete IGH gene rearrangements derived from bone marrow mononuclear cells is normal.
Junction analysis of DH-JH gene rearrangements
| . | D(del) . | Palindromic . | Nontemplated . | Palindromic . | (del)J . | Total palindromic . | Total del . |
|---|---|---|---|---|---|---|---|
| NBS (n = 97) | −5.2 ± 0.5 | 0.2 ± 0.06 | 7.6 ± 0.8 | 0.1 ± 0.04 | −5.6 ± 0.5 | 0.2 ± 0.07 | 10.8 ± 0.8 |
| nlBM (n = 91) | −4.5 ± 0.4 | 0.2 ± 0.07 | 9.2 ± 0.8 | 0.1 ± 0.06 | −6.7 ± 0.5 | 0.3 ± 0.1 | 11.2 ± 0.6 |
del indicates deletion, and nlBM, normal bone marrow.
No differences in VH, DH, and JH gene segment usage
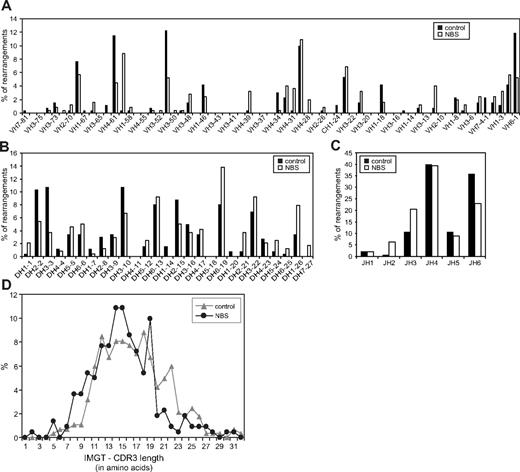
In addition to incomplete IGH gene rearrangements, also complete (ie, VH-DH-JH) gene rearrangements were analyzed. This analysis was focused on gene segment usage to exclude the possibility of a difference in targeting the V(D)J recombination machinery to the IGH gene locus. The gene segment usage patterns of NBS patients were largely similar to the patterns of healthy controls (Figure 5A-C). Only small differences were observed in JH gene segment usage. The length of the complementarity determining regions 3 (CDR3) did also not differ between NBS patients and controls (Figure 5D). In summary, NBS patients do not have a defect in gene segment usage and composition of the coding joints of successful Ig gene rearrangements.
Gene segment usage and CDR3 length of bone marrow-derived IGH gene rearrangements of NBS patients and controls. Frequency of VH (A), DH (B), and JH (C) gene segment usage was determined in complete IGH gene rearrangements as amplified from bone marrow mononuclear cells. In total, 257 and 265 IGH gene rearrangements were analyzed in 5 different healthy controls and 10 NBS patients, respectively. (D) The length of the CDR3 regions was determined in the IGH gene rearrangements of healthy controls (n = 284) and NBS patients (n = 221) and did not show a difference.
Gene segment usage and CDR3 length of bone marrow-derived IGH gene rearrangements of NBS patients and controls. Frequency of VH (A), DH (B), and JH (C) gene segment usage was determined in complete IGH gene rearrangements as amplified from bone marrow mononuclear cells. In total, 257 and 265 IGH gene rearrangements were analyzed in 5 different healthy controls and 10 NBS patients, respectively. (D) The length of the CDR3 regions was determined in the IGH gene rearrangements of healthy controls (n = 284) and NBS patients (n = 221) and did not show a difference.
Reduced resolution of breaks in IGH locus during B-cell differentiation
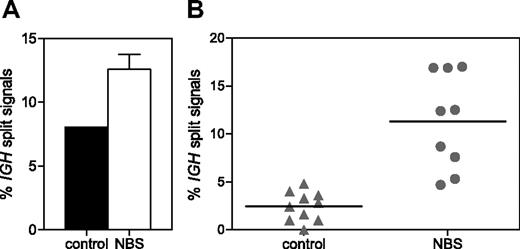
To determine whether NBS patients have an accumulation of unrepaired IGH coding ends as suggested previously,35 IGH split-signal FISH was performed on pre-B-I and mature B cells sorted from 3 NBS patients and healthy donors. A separate green and red signal together with a colocalized red/green signal was found in 12.6% and 8.0% of pre-B-I cells of NBS patients and controls, respectively (Figure 6A). In mature B cells of healthy controls (n = 10), the percentage of split signals was reduced to 2.5%; but in mature B cells of NBS patients (n = 9), the percentage remained high (11.3%; Figure 6B). The difference in percentage of split signals was statistically significant (P < .001). This indicates that in NBS patients the resolution of IGH breaks does not function properly.
IGH split-signal FISH. The percentage of split IGH signals (separate green and red signal together with a colocalized red/green signal) was determined on sorted pre-B-I cells of 3 NBS patients and a healthy donor (A) and on sorted mature B cells of 10 healthy donors and 9 NBS patients (B). The difference in percentage of split signals in mature B cells of NBS patients and healthy donors was statistically significant (P < .001).
IGH split-signal FISH. The percentage of split IGH signals (separate green and red signal together with a colocalized red/green signal) was determined on sorted pre-B-I cells of 3 NBS patients and a healthy donor (A) and on sorted mature B cells of 10 healthy donors and 9 NBS patients (B). The difference in percentage of split signals in mature B cells of NBS patients and healthy donors was statistically significant (P < .001).
Discussion
NBS patients have an immunodeficiency that is characterized by reduced absolute numbers of B lymphocytes and T lymphocytes in peripheral blood. A classic V(D)J recombination defect was excluded previously based on the presence of normal Ig gene rearrangements (ie, rearrangements of normal length and composition) in peripheral blood B lymphocytes.22,23 However, these studies left open the possibility for a V(D)J recombination defect during bone marrow precursor B-cell differentiation in combination with positive selection of reduced numbers of B cells carrying normally rearranged Ig loci. Our study shows that NBS patients have a disturbed precursor B-cell differentiation pattern and significant disturbances in the resolution of RAG-induced IGH breaks and compensatory proliferation of mature B cells.
The precursor B-cell compartment of NBS patients was characterized by a significant increase of the pro-B and pre-B-I cell fractions in combination with a strong reduction in the pre-B-II cell and, to a lesser extent, in the immature B-cell fraction. Mature B cells, which are regarded as peripheral B cells, were clearly detectable. This leaky block at the pre-B-I/pre-B-II transition is characteristic for NBS and does not resemble the aberrant precursor B-cell differentiation patterns of XLA patients with a defect in pre-BCR signaling or RAG-deficient SCID patients with a complete defect in V(D)J recombination that lack mature B cells. However, it suggests that NBS patients have a hitch in the V(D)J recombination process.
V(D)J recombination at the IGH locus was initiated normally in NBS pre-B-I cells, and correct Ig rearrangements could be formed. The composition of the coding joints as well as the gene segment usage was not affected. However, not all RAG-induced breaks that occur during the rearrangement process were successfully repaired because DNA ends derived from RAG-induced breaks in the IGH locus of pre-B-I cells frequently lost juxtaposition. This phenomenon was also found in pre-B-I cells of healthy donors, albeit at a lower frequency. However, in striking contrast to mature B cells of NBS patients, breaks in mature B cells of healthy controls were either correctly repaired or cells with incorrectly or unrepaired breaks were counterselected, given that IGH split signals were almost absent in mature B cells of healthy controls. Lack of NBN therefore seems to result in a higher frequency of loss of juxtaposition of DNA ends of the RAG-induced breaks. Apparently, the NBN defect results in a quantitative efficiency recombination problem rather than a qualitative one. This is in line with previous observations in NBN-deficient cells, in which increased loss of juxtaposition had been demonstrated in cultured murine pre-B cell lines and in developing lymphocytes.35 It also fits with the “sticky ball” model that proposes that the MRN complexes are required for tethering the DNA ends.17
Increased loss of juxtaposition reduces the chance for a successful and functional IGH gene rearrangement. This can explain the higher relative frequency of pre-B-I cells in NBS because NBN-deficient pre-B-I cells will need more attempts for making a successful gene segment coupling for obtaining a functional IGH gene rearrangement. Moreover, not every pre-B-I cell will finally reach the pre-B-II cell stage because this requires, by definition, a functional IGH gene rearrangement; and if none is formed, the pre-B-I cell will finally be lost. However, in the limited number of pre-B-I cells where repair does occur, the junctional region appears to be normal.
On formation of a functional IGH gene rearrangement, an Igμ chain is expressed together with the surrogate light chain as a pre-BCR. This stage is referred to as the pre-B-II cell stage. On pre-BCR expression and activation, pre-B-II cells start proliferating. This clonal expansion phase is followed by G1 arrest, during which the surrogate light chain is down-regulated and the RAG genes are reexpressed, allowing rearrangement of the Ig light chain loci. NBN-deficient pre-B-I cells entering the pre-B-II cell stage continued to have a high frequency of IGH split signals as detected by FISH analysis (data not shown). This implies that the RAG-induced breaks have either not been repaired or have been repaired incorrectly leading to trans-rearrangements or chromosome translocations.4
If the RAG-induced breaks in the IGH locus have not been repaired when entering the pre-B-II cell stage, the pre-B-II cell will die during the proliferation phase because abrogation of MRN function prevents a cell-cycle arrest for repair of DNA DSBs at a prereplicative stage.35 It is known that ATM is required to stabilize DNA DSBs during V(D)J recombination, enabling correct cell-cycle checkpoint regulation and DNA repair.36 As NBS patients exhibit impaired ATM activity, it is possible that the reduction in the size of the pre-B-II cell compartment is caused by the long-term persistence of V(D)J-induced DSBs followed by increased cell death. If, however, the RAG-induced breaks have been repaired, although incorrectly with formation of trans-rearrangements or chromosome aberrations, the pre-B-II cell might still acquire a functional rearrangement at the second IGH allele and undergo proliferation and proceed its differentiation to the immature B-cell stage if a successful Ig light chain rearrangement is formed as well. It should be noted that, similar to the IGH gene rearrangement process, the Ig light chain rearrangement process will also be less efficient because of loss of juxtaposition of RAG-induced DNA ends, leading to the induction of chromosome aberrations and to the generation of unrepaired breaks with concomitant cell loss. This will also contribute to the reduction of the pre-B-II cell stage.
The reduced number of NBN-deficient precursor B cells that successfully pass the V(D)J recombination and the proliferation phases will differentiate into immature B cells, migrate to the periphery, and become mature B cells. The efflux of B cells from bone marrow, however, will be low given the serious NBN-related defect in precursor B-cell differentiation. The absolute number of peripheral B lymphocytes indeed shows a 4-fold reduction at young age (< 2 years). However, the absolute number of B lymphocytes remained stable with increasing age and did not further decline. The absolute numbers of B cells of patients older than 18 years even reached a low normal level. This observation can partly be explained by the fact that, with increasing age, the frequency of immature and mature B cells in bone marrow increases. However, the major compensatory mechanism will be increased (homeostatic) proliferation of mature B cells, which was already observed in young NBS patients (< 5 years). This indicates that, despite extensive proliferation, the absolute number of peripheral B cells is decreased. The precursor B-cell differentiation defects resulting in a low efflux of B cells in combination with a proliferative compensation will definitely affect the B-cell repertoire of the peripheral B-cell pool of NBS patients. However, currently available techniques are unable to measure or visualize this assumed decrease in B-cell repertoire diversity. We hypothesize that a limited BCR repertoire will contribute to the observed immunodeficiency in NBS patients.
The age-related changes in the precursor B-cell compartment of NBS patients show a progressive reduction of the early precursor B-cell subsets. We hypothesize that the precursor B-cell system in NBS patients is under great pressure to produce sufficient peripheral B cells. The DSB-repair defect and the related inefficient generation of mature B cells lead to a premature exhaustion of the precursor B-cell compartment within the first 15 years of life. This premature immunosenescence will not only result in reduced B-cell counts, but also in a narrow Ig repertoire.
In conclusion, NBS patients have an immunodeficiency caused by reduced numbers of peripheral B lymphocytes and T lymphocytes. The reduction of B lymphocytes can be explained by an NBN deficiency-derived precursor B-cell differentiation problem that results from loss of juxtaposition of RAG-induced DNA ends and probably incorrect ATM-dependent cell-cycle checkpoint control. The resulting reduction in bone marrow B-cell efflux is partly compensated by increased proliferation of mature B cells. Even though this could not be studied in bone marrow, it is fair to assume that similar problems occur during T-cell differentiation and are at the basis of the reduced T-lymphocyte numbers in these patients.
The publication costs of this article were defrayed in part by page charge payment. Therefore, and solely to indicate this fact, this article is hereby marked “advertisement” in accordance with 18 USC section 1734.
Acknowledgments
The authors thank Dr Dik C. van Gent for critical reading of the manuscript, and Mr E. de Haas and Mr B. Bartol for technical support.
This work was supported by the Polish Ministry of Higher Education and Science (grant 2P05A11829; K.H.C.) and the Dutch Organization for Scientific Research (veni grant 916.56.107, NWO/ZonMW; M.v.d.B.).
Authorship
Contribution: M.v.d.B., M.P., E.B., J.J.M.v.D., K.H.C., and A.W.L. designed research; M.v.d.B., M.A.B., B.G.-K., H.G., and B.H.B. performed research; M.v.d.B., M.P., M.A.B., B.G.-K., A.W., B.D.-B., H.G., B.H.B., M.K.-W., E.B., J.J.M.v.D., K.H.C., and A.W.L. analyzed data; and M.v.d.B., J.J.M.v.D., K.H.C., and A.W.L. wrote the paper.
Conflict-of-interest disclosure: The authors declare no competing financial interests.
Correspondence: Anton W. Langerak, Erasmus MC, Department of Immunology, Dr Molewaterplein 50, 3015 GE Rotterdam, The Netherlands; e-mail: a.langerak@erasmusmc.nl.

This feature is available to Subscribers Only
Sign In or Create an Account Close Modal