

Abstract
Abstract 667
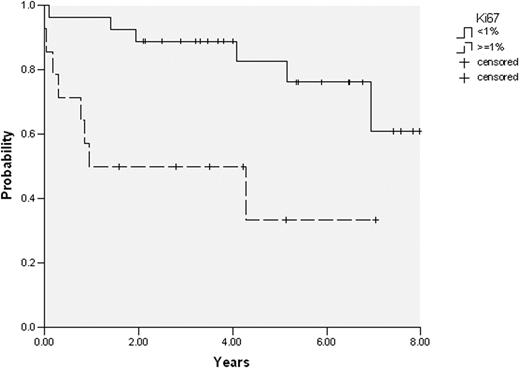
Historically CLL has been considered a non-proliferative disease characterized by accumulation of leukemic cells. However, recent clinical and biological observations are questioning this concept. From the clinical standpoint, although some patients have lymphocyte counts stable during the course of the disease, others exhibit a short lymphocyte doubling time, suggesting the existence of a significant cell proliferation. Some specific anatomic locations (bone marrow (BM) and lymph nodes) seem to be more prone to proliferation than peripheral blood (PB). The amount of cell proliferation and its prognostic significance has not been properly analyzed. Against this background, gene expression profiling of proliferation genes and the amount of cell proliferation in different tissue compartments (BM and PB) were examined in patients with CLL. In isolated CD19/CD5+ tumoral cells from 20 paired PB and BM samples, expression of genes (n=93) involved in the initiation and development of the cell cycle was analyzed by low-density TaqMan® arrays. The amount of proliferative (Ki67 positive) CLL cells was measured by flow cytometry in 50 paired samples. In addition, coexpression of molecules associated with cellular activation (CD38, CD71, CD69), adhesion (CD49d), chemokine receptors (CXCR4, CXCR3, CCR7), interaction between T and B cells (CD86), signaling (ZAP-70), and Toll-like receptors (TLR9) was compared between Ki67+ and Ki67- CLL subpopulations. Finally, the degree of proliferation was correlated with the main clinical and biological characteristics. As assessed by gene expression profile, the great majority of genes involved in the initiation and development of cell cycle were more expressed in BM than in PB. Of note, Ki67+ CLL cells were significantly higher in BM than in PB (mean: 1.13% vs 0.88%; p= 0.004). This difference on Ki67+ expression between BM and PB was particularly significant (mean: 1.6% vs 1.1%; p=0.01) in patients who progressed of their disease at any particularly time (n=20), whereas it was not observed in patients with stable disease. Proliferating (Ki67+) CLL cells had significantly increased expression of ZAP-70 (mean fluorescence intensity (MFI): 162 vs 94, p<0.001), CD38 (MFI: 75 vs 27, p<0.001), CD86 (MFI: 31 vs 11, p=0.002), CD71 (MFI: 73 vs 24, p<0.001), and TLR9 (MFI: 49 vs 25, p<0.001) in comparison to non-proliferating Ki67- cells; CXCR4 was significantly decreased in proliferating cells (MFI: 212 vs 340, p=0.006). No differences were observed in CD49d, CD69, CCR7, and CXCR3 expression between Ki67+ and Ki67- CLL cells. When Ki67 expression was analyzed at diagnosis (n=41 paired samples, median follow-up of 4.2 years), patients with Ki67+ CLL cells ≥ 1% in BM had a shorter time to progression than those with Ki67 <1% (progression at 4 years: 47% vs 12%, respectively; p=0.008) (figure). In addition, patients with lymphocyte doubling time < 12 months, ZAP-70 expression ≥ 20%, or CD38 expression ≥ 30%, but not with increased CD49d expression, exhibit a higher percentage of Ki67+ CLL cells in both BM and PB (Table). In conclusion, in CLL expression of genes related to proliferation was significantly increased in BM compared to PB. Moreover, the number of proliferating CLL cells was also increased in BM, particularly in those patients with an aggressive disease, and presented different immunophenotype characteristics in comparison to non-proliferating CLL cells. Finally, the amount of Ki67+ CLL cells correlated with a shorter time to progression. These results challenge the concept of CLL as disease more accumulative than proliferative. These new insights on the proliferation pathways in CLL not only may provide a better understanding of the pathogenesis of this disease, but also would be of prognostic relevance and can support the use of new treatments aimed at inhibiting proliferation in CLL.
| Lymphocyte doubling time | ZAP-70 | CD38 | CD49d | |||||||||
|---|---|---|---|---|---|---|---|---|---|---|---|---|
| <12 months (n=10) | >12 months (n=37) | ≥20% (n=15) | <20% (n=35) | ≥30% (n=19) | <30% (n=31) | ≥30% (n=17) | <30% (n=32) | |||||
| Mean% Ki67+ CLL cells in PB | 1.2 | 0.7 | P=0.02 | 1.4 | 0.6 | P<0.001 | 1.1 | 0.7 | P=0.015 | 1.1 | 0.8 | P=0.08 |
| Mean% Ki67+ CLL cells in BM | 1.6 | 0.8 | P=0.032 | 2 | 0.8 | P=0.001 | 1.3 | 1 | P=0.19 | 1.5 | 0.9 | P=0.053 |

Disclosures:
No relevant conflicts of interest to declare.

This feature is available to Subscribers Only
Sign In or Create an Account Close Modal