Abstract
Abstract 3663
Poster Board III-599
Thymus and Activation Related Chemokine (TARC) is produced in high amounts by Hodgkin and Reed-Sternberg (HRS) cells in classical Hodgkin lymphoma (cHL). It attracts CCR4 positive Th2 and Treg cells, which are typically present in large numbers in the reactive infiltrate in cHL. TARC can be measured in the serum of cHL patients and is usually elevated in the presence of active disease, as compared to healthy controls. Higher levels are observed in advanced stage disease, compared to stage I disease. The goal of the current study was to correlate TARC serum levels to metabolic response to therapy as measured by FDG-PET scanning.
Newly diagnosed cHL patients treated in our hospital were asked to participate. Serum samples were taken before the start of treatment, at the time of the mid treatment PET scan (after 2 cycles of ABVD for stage I and II, or mid BEACOPP or ABVD treatment for stage III and IV disease) and at the time of the PET scan after completion of chemotherapy. TARC serum levels were measured by ELISA and TARC immunohistochemistry was done on primary involved lymph node tissue.
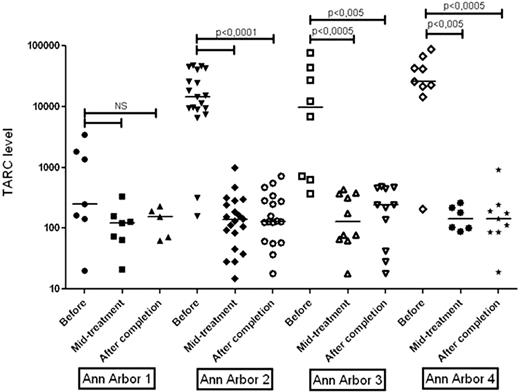
A total of 59 cHL patients, median age 40 (range 16-80) and 49% male participated. Eight patients had stage I, 26 stage II, 14 stage III and 10 stage IV disease. The known association of high pretreatment TARC levels with advanced stage was also significantly present in our data, supporting the hypothesis that serum TARC levels reflect tumor burden. Moreover, in stage I and II patients, bulky disease (27%) was associated with a significant higher TARC level, lending further support to this hypothesis. Compared to pretreatment values, TARC levels had decreased significantly at mid treatment and treatment completion to the range of healthy controls. Only in stage I there was no significant difference between pretreatment and mid or after treatment samples (see figure), probably due to the relatively large number of patients without elevated TARC before the start of therapy. In patients with a positive PET scan at mid treatment (26%), there was a trend for a higher TARC level (P=0.08) compared to PET negative patients. After completion of chemotherapy PET positivity (19%) was significantly associated with a higher TARC level. Three patients had a relapse and at that time TARC levels had clearly increased in comparison to the levels after treatment.
serum TARC levels are associated with tumor burden and metabolic response to therapy as measured by FDG-PET scan. Measurement of serum TARC levels is a potential tool to evaluate the response to therapy and to be used in follow up after completion of chemotherapy. Inclusion of more patients is necessary to further assess the clinical value of TARC serum levels and is ongoing.
No relevant conflicts of interest to declare.
Author notes
Asterisk with author names denotes non-ASH members.


This feature is available to Subscribers Only
Sign In or Create an Account Close Modal