Abstract
Abstract 3380
Poster Board III-268
For adult allogeneic HCT candidates lacking a matched family donor, an alternative donor (unrelated or mismatched family) remains the most feasible option. Lower intensity conditioning using RIC or NST regimens is increasingly used in NHL to lower transplant related mortality (TRM) while retaining graft vs. lymphoma effect. We analyzed the outcomes of 248 (61% male) adult recipients of HCT for NHL from alternative donors after RIC/NMA conditioning reported to the CIBMTR from 1997 to 2004. Recipients of any prior transplants and those in first complete remission from follicular NHL were excluded. Outcomes of TRM, progression, progression-free survival (PFS) and overall survival (OS) were analyzed in multivariate regression models adjusting for key pre-transplant variables.
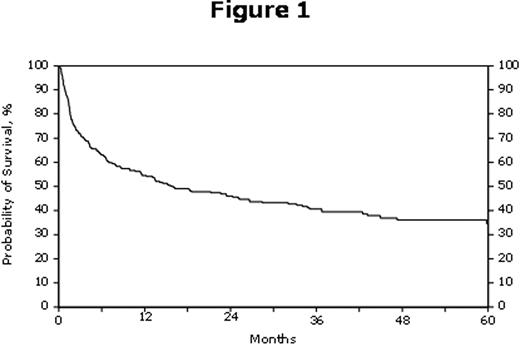
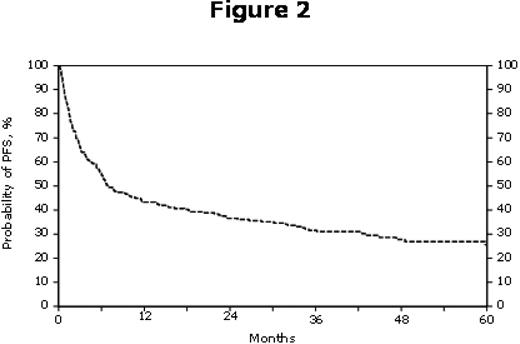
Median age was 52 (range, 18-72 yrs); 36% having a Karnofsky performance score ≤90. Follicular NHL (43%) was the major histology with 75% in stages III and IV, 47% with chemotherapy resistant disease and only 18% in CR2. Patients received BM (43%) or PBSC (57%) grafts from unrelated well matched/partially matched/mismatched (61% /19% /9% respectively) or related mismatched (10%) donors. Conditioning included fludarabine with either melphalan (20%), TBI (11%), cyclophosphamide (25%), or busulfan (12%); busulfan/cyclophosphamide (RIC) (2%); BEAM (6%); CBV (8%); and others (16%). Use of RIC/NMA regimens increased yearly during the study period from 7 in 1997 to 121 in 2003. Cumulative incidence of grade II-IV acute GVHD (aGVHD) was 43%; and chronic GVHD (cGVHD) was 36% at 1 year and 44% at 3 years. The TRM at 28 and 100 days was 11% and 24%, respectively. Outcomes at a median follow-up of 44 months summarized in Table 1, Figure 1 and Figure 2.
| . | Probability (95% CI) . | ||
|---|---|---|---|
| Outcomes | 1 year | 3 years | 5 years |
| TRM | 31 (25 - 37)% | 39 (32 - 45)% | 43 (36 - 50)% |
| Relapse/Progression | 26 (20 - 31)% | 30 (24 - 36)% | 31 (26 - 38)% |
| PFS | 43 (37 - 50)% | 32 (26 - 37)% | 26 (19 - 32)% |
| OS | 55 (48 - 61)% | 41 (34 - 47)% | 35 (28 - 42)% |
In multivariate analysis (Table 2) the use of ATG and HLA mismatch were associated with an increased TRM. Higher age (≥ 60), non-follicular histology, advanced disease status at HCT and later year of HCT were associated with higher risk of relapse. High-grade histology, the use of ATG, and chemotherapy resistant disease at HCT were associated with higher risk of treatment failure or lower PFS. Higher age, shorter interval from diagnosis to HCT, non-TBI conditioning regimens or T-cell depletion and HLA mismatched unrelated donors were associated with lower risk of survival. Acute or chronic GVHD did not influence TRM or PFS. Common causes of death were disease recurrence (n=40), organ failure (n=29), GVHD (n=23). In NHL patients without sibling donor options, alternative donor HCT with RIC/NMA conditioning results in favorable long-term survival although advanced age, histology and resistant disease status remain concerning. Higher grade NHL, use of ATG or T-cell depletion and HLA mismatch were associated with inferior outcomes. Lack of an available sibling donor should not be a barrier to allogeneic HCT in the appropriate patient.
| Variables . | Relative Risk (95% CI) . | P-value . |
|---|---|---|
| TRM | ||
| ATG: No vs. Yes | 2.13 (1.40 - 3.25) | <0.001 |
| Donor type: Unrelated well matched vs. mismatched | 2.07 (1.17 - 3.84) | 0.02 |
| Relapse | ||
| Age: ≤ 60 vs. >60 | 1.93 (1.07 - 3.48) | 0.028 |
| Histology: Follicular vs. Diffuse Large B Cell | 3.46 (1.80 - 6.34) | <0.001 |
| Status: CR2+ vs. REL Resistant | 5.05 (2.13 - 11.99) | <0.001 |
| Risk of Treatment Failure | ||
| Histology: Follicular vs. Lymphoblastic/Burkitts/Burkitt-like | 2.11 (1.40 - 3.18) | <0.001 |
| Status: CR2+ vs. REL Resistant | 2.54 (1.50 - 4.31) | 0.001 |
| ATG: No vs. Yes | 1.50 (1.07 - 2.10) | 0.020 |
| Time from diagnosis to transplant: ≥ 24 vs. 12 – 24 months | 1.58 (1.09 – 2.31) | 0.017 |
| Risk of Mortality | ||
| Age: ≤ 60 vs. > 60 | 1.77 (1.16 - 2.70) | 0.009 |
| Time from diagnosis to transplant: ≥ 24 vs. 12 – 24 months | 2.26 (1.56 - 3.27) | <0.001 |
| TBI: Yes vs. No | 2.17 (1.36 - 3.48) | 0.001 |
| Donor type: Unrelated well matched vs. mismatched | 2.20 (1.24 - 3.90) | 0.007 |
| GVHD prophylaxis: FK506/MTX vs. T-cell depletion | 6.0 (2.68 - 13.45) | <0.001 |
No relevant conflicts of interest to declare.
Author notes
Asterisk with author names denotes non-ASH members.


This feature is available to Subscribers Only
Sign In or Create an Account Close Modal