Abstract
Abstract 3199
Poster Board III-136
Differences between hypoplastic MDS (h-MDS) and aplastic anemia (AA) are not defined. Role of karyotype and fluorescent in situ hybridization (FISH) in these diseases is not established.
Medical record review at Seoul National University Hospital between 1990 and 2008 was performed. Patients diagnosed as either h-MDS or AA based on morphology was reviewed. We assessed overall survival (OS) and leukemic conversion.
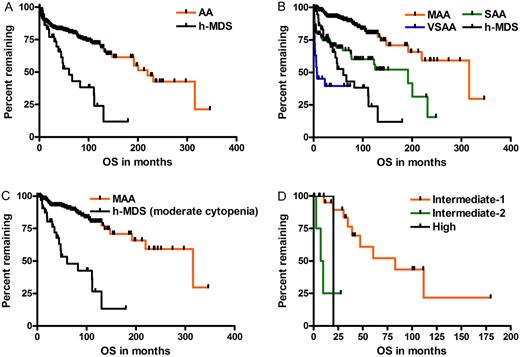
369 AA and 40 h-MDS patients (median age 39 years, range 15-82) were analyzed. 235 and 165 patients underwent karyotyping and FISH at diagnosis respectively. Compared to AA, karyotypic abnormality, 5q deletion, trisomy 8 and trisomy 1q FISH abnormalities were more frequently found in h-MDS. Median OS of h-MDS was shorter than AA (60 vs. 219 months, p<0.001) with prognosis of h-MDS falling between severe and very severe AA. Patients with h-MDS had more frequent leukemic conversion (p<0.001) than AA patients. Karyotypic abnormality was not prognostic in AA (p=0.225). For h-MDS, complex karyotype and trisomy 1q FISH abnormality predicted poor prognosis.
The prognosis of h-MDS falls between severe and very severe AA. h-MDS accompanies frequent karyotypic and FISH abnormality and is prone to leukemic conversion. Complex karyotype and trisomy 1q FISH abnormality may have a prognostic role in h-MDS.
Characteristics of patients according morphologic classification in 409 patients
| Characteristics . | Aplastic anemia (N=369) . | Hypoplastic MDS (N=40) . | p-value . |
|---|---|---|---|
| Age (median) | 38.0 | 49.5 | 0.005 |
| Gender | 0.846 | ||
| Male | 197 | 22 | |
| Female | 172 | 18 | |
| White blood cell (mean) (/μL) | 2724 | 3042 | 0.368 |
| Reticulocyte count (mean) (%) | 1.1 | 1.8 | 0.007 |
| Hemoglobin (mean) (g/dL) | 8.3 | 7.9 | 0.357 |
| Platelet (mean) (/μL) | 44130 | 109000 | 0.008 |
| Severity of cytopenia* | 0.007 | ||
| Moderate | 244 | 36 | |
| Severe | 96 | 4 | |
| Very severe | 28 | 0 | |
| PNH component | NA | ||
| Present | 15 | NA | |
| Absent | 351 | NA | |
| IPSS risk category | NA | ||
| Intermediate-1 | NA | 25 | |
| Intermediate-2 | NA | 4 | |
| High | NA | 1 | |
| Oxymetholone administration# | 0.005 | ||
| Yes | 167 | 9 | |
| No | 196 | 30 | |
| Immunosuppressive treatment# | 0.005 | ||
| Yes | 114 | 4 | |
| No | 249 | 35 | |
| Stem cell transplantation# | 1.000 | ||
| Yes | 49 | 5 | |
| No | 314 | 34 |
OS of patients according to disease subtype h-MDS had inferior OS compared to AA in general (A), and its prognosis falls between SAA and VSAA (B). h-MDS had shorter OS compared to AA even stratified by the degree of cytopenia. IPSS score had a prognostic impact on h-MDS (D).
OS of patients according to disease subtype h-MDS had inferior OS compared to AA in general (A), and its prognosis falls between SAA and VSAA (B). h-MDS had shorter OS compared to AA even stratified by the degree of cytopenia. IPSS score had a prognostic impact on h-MDS (D).
No relevant conflicts of interest to declare.
Author notes
Asterisk with author names denotes non-ASH members.


This feature is available to Subscribers Only
Sign In or Create an Account Close Modal