

Abstract
The adaptive immune system uses several strategies to generate a repertoire of T- and B-cell antigen receptors with sufficient diversity to recognize the universe of potential pathogens. In αβ T cells, which primarily recognize peptide antigens presented by major histocompatibility complex molecules, most of this receptor diversity is contained within the third complementarity-determining region (CDR3) of the T-cell receptor (TCR) α and β chains. Although it has been estimated that the adaptive immune system can generate up to 1016 distinct αβ pairs, direct assessment of TCR CDR3 diversity has not proved amenable to standard capillary electrophoresis-based DNA sequencing. We developed a novel experimental and computational approach to measure TCR CDR3 diversity based on single-molecule DNA sequencing, and used this approach to determine the CDR3 sequence in millions of rearranged TCRβ genes from T cells of 2 adults. We find that total TCRβ receptor diversity is at least 4-fold higher than previous estimates, and the diversity in the subset of CD45RO+ antigen-experienced αβ T cells is at least 10-fold higher than previous estimates. These methods should prove valuable for assessment of αβ T-cell repertoire diversity after hematopoietic cell transplantation, in states of congenital or acquired immunodeficiency, and during normal aging.
Introduction
The ability of the adaptive immune system to respond to any of the vast number of potential foreign antigens to which a person might be exposed relies on the highly polymorphic receptors expressed by B cells (immunoglobulins) and T cells (T-cell receptors [TCRs]). The TCRs expressed by αβ T cells, which primarily recognize peptide antigens presented by major histocompatibility complex (MHC) class I and II molecules, are heterodimeric proteins consisting of 2 polypeptide chains (α and β), each containing one variable and one constant domain. The peptide specificity of αβ T cells is primarily determined by the amino acid sequence encoded in the third complementarity-determining region (CDR3) loops of the α- and β-chain variable domains.1 The CDR3 regions are formed by recombination between noncontiguous variable (Vβ), diversity (Dβ), and joining (Jβ) gene segments in the β-chain locus, and between analogous Vα and Jα gene segments in the α-chain locus. The existence of multiple such gene segments in the β- and α-chain loci allows for a large number of distinct CDR3 sequences to be encoded. CDR3 sequence diversity is further increased by template-independent addition and deletion of nucleotides at the Vβ-Dβ, Dβ-Jβ, and Vα-Jα junctions during the process of TCR gene rearrangement.
Previous assessments of the diversity of receptors in the adult human αβ T-cell repertoire have relied on exhaustive capillary-based sequencing of rearranged TCRα and β genes expressed in small, well-defined subsets of the repertoire, followed by extrapolation of the diversity present in these subsets to the entire repertoire.2 Such efforts have produced an estimate of approximately 106 unique TCRβ-chain CDR3 sequences per person, with 10% to 20% of these unique TCRβ CDR3 sequences expressed by cells in the antigen-experienced CD45RO+ compartment.2 However, the accuracy and precision of this estimate is severely limited by the need to extrapolate the diversity observed in hundreds of sequences from subsets of cells to the entire repertoire, and it is possible that the actual number of unique TCRβ-chain CDR3 sequences in the αβ T-cell repertoire is significantly larger than 106.
Recent advances in high-throughput DNA sequencing technology allow for significantly deeper sequencing than is possible using capillary-based technologies. The Illumina Genome Analyzer (GA) allows for the parallel sequencing of millions of short templates.3 In the GA system, a library of template molecules carrying universal polymerase chain reaction (PCR) adapter sequences at each end is hybridized to a lawn of complementary oligonucleotides immobilized on a solid surface. Solid-phase PCR is used to amplify the hybridized library, resulting in millions of template clusters on the surface, each composed of multiple identical copies of a single DNA molecule from the library, and reversible dye-termination chemistry is used to sequence a 30- to 54-nucleotide interval in the molecules in each cluster. We adapted the Illumina GA system to permit simultaneous sequencing from genomic DNA of the rearranged TCRβ CDR3 regions carried in millions of T cells. This approach enables direct sequencing of a significant fraction of the uniquely rearranged TCRβ CDR3 regions in populations of αβ T cells whose diversity far exceeds the capabilities of conventional capillary-based DNA sequencing instruments, and also permits estimation of the relative frequency of each CDR3 sequence in the population.
Accurate estimation of the diversity of TCRβ CDR3 sequences in the entire αβ T-cell repertoire from the diversity measured in a finite sample of T cells requires an estimate of the number of CDR3 sequences present in the repertoire that were not observed in the sample. An analytic solution to an analogous problem, termed the “unseen species problem,” was identified more than 60 years ago by the statistician Fisher et al,4 and has been widely applied to the estimation of total species diversity in large populations using diversity measurements in random, finite samples. We applied an extension of Fisher et al's analytic solution by Efron and Thisted5 to the estimation of TCRβ-chain CDR3 diversity in the entire αβ T-cell repertoire, using direct measurements of the number of unique TCRβ CDR3 sequences observed in blood samples containing millions of αβ T cells. We identify a lower bound for TCRβ CDR3 diversity in the CD4+ and CD8+ T-cell compartments that is 4-fold higher than previous estimates. In addition, our results demonstrate that there are at least 1.4 × 10⁶ unique TCRβ CDR3 sequences in the CD45RO+ compartment of antigen-experienced T cells, a large proportion of which are present at low relative frequency.
Methods
Sample acquisition, cell sorting, and genomic DNA extraction
Blood samples from 2 healthy male, cytomegalovirus–seronegative donors aged 35 and 37 years, were obtained with written informed consent obtained in accordance with the Declaration of Helsinki using forms approved by the Institutional Review Board of the Fred Hutchinson Cancer Research Center (FHCRC). Peripheral blood mononuclear cells were isolated and stained for 20 minutes at 4°C with the following anti–human antibodies: CD4-fluorescein isothiocyanate (clone M-T466; Miltenyi Biotec), CD8-phycoerythrin (clone RPA-T8; BD Biosciences), and CD45RO-ECD (clone UCHL-1; Beckman Coulter) or CD45RO-allophycocyanin (clone UCHL-1; BD Biosciences). Four lymphocyte subsets, CD8+CD45RO+/− and CD4+CD45RO+/−, were isolated using the BD FACSAria cell-sorting system (BD Biosciences). Data were analyzed with FlowJo software (Tree Star Inc). Total genomic DNA was extracted from sorted cells using the QIAamp DNA blood Mini Kit (QIAGEN). The approximate mass of a single haploid genome is 3 pg. To sample millions of rearranged TCRβ CDR3 regions in each T-cell compartment, we isolated 6 to 27 μg template DNA from each compartment (supplemental Table 1, available on the Blood website; see the Supplemental Materials link at the top of the online article).
Multiplex PCR amplification of TCRβ CDR3 regions
To generate the template library for the Genome Analyzer, a multiplex PCR system was designed to amplify rearranged TCRβ loci from genomic DNA, using 45 forward primers (supplemental Table 2), each specific to a functional TCR Vβ segment, and 13 reverse primers (supplemental Table 3), each specific to a TCR Jβ segment (Figure 1). The forward and reverse primers contain at their 5′ ends the universal forward and reverse primer sequences, respectively, compatible with the GA2 cluster station solid-phase PCR. The Illumina GA2 System generates reads of length 54 base pairs (bp), which covers the entire range of CDR3 lengths. Analysis of data in the International ImMunoGeneTics Information System (IMGT) database6,7 shows that the average Jβ deletion is 4 plus or minus 2.5 bp, which implies that 5′ Jβ deletions greater than 10 nucleotides occur in less than 1% of sequences. The 13 different Jβ gene segments each have a unique “tag” sequence between positions +12 and +18 downstream of the recombination signal sequence. Sequencing primers were designed to anneal to a consensus nucleotide motif observed just downstream of this tag, so that the first several bases of sequence will uniquely identify the J segment (supplemental Table 4). The average length of the CDR3 region is 35 plus or minus 3 bp,7 so sequences starting from the Jβ segment tag will routinely capture the complete CDR3 region in a 54-bp read.

Strategy for PCR amplification, hybridization, and sequencing of rearranged TCRβ CDR3 regions. A generic rearranged TCRβ CDR3 region PCR product is shown, indicating the constituent Vβ segment, Dβ segment, Jβ segment, and the nontemplated nucleotides inserted at the Vβ-Dβ and Dβ-Jβ junctions. Universal adapter sequences that permit solid-phase PCR on the Illumina Genome Analyzer Cluster Station (GA F and GA R) are incorporated into the 5′ and 3′ ends of the PCR products that capture each rearranged TCRβ CDR3 region. Forty-five forward primers were designed, each specific to a single functional Vβ segment or a small family of Vβ segments. The 3′ end of each Vβ forward primer is anchored at position −43 in the Vβ segment, relative to the recombination signal sequence, thereby providing a unique Vβ tag sequence within the amplified region. Vβ forward primers were designed for all known nonpseudogenes in the TCRβ locus. The 13 reverse primers specific to each Jβ segment are anchored in the 3′ intron, with the 3′ end of each primer crossing the intron/exon junction. The Jβ reverse primers were designed to be anchored at their 3′ ends on a consensus splice site motif to minimize overlap with the sequencing primers. Thirteen sequencing primers were designed that are complementary to the amplified portion of the Jβ segment, such that the first few bases of sequence generated will capture the unique Jβ tag sequence. The sequencing primers were designed so that promiscuous priming of a sequencing reaction for one J segment by a primer specific to another J segment would generate sequence data starting at exactly the same nucleotide as sequence data from the correct sequencing primer.
Strategy for PCR amplification, hybridization, and sequencing of rearranged TCRβ CDR3 regions. A generic rearranged TCRβ CDR3 region PCR product is shown, indicating the constituent Vβ segment, Dβ segment, Jβ segment, and the nontemplated nucleotides inserted at the Vβ-Dβ and Dβ-Jβ junctions. Universal adapter sequences that permit solid-phase PCR on the Illumina Genome Analyzer Cluster Station (GA F and GA R) are incorporated into the 5′ and 3′ ends of the PCR products that capture each rearranged TCRβ CDR3 region. Forty-five forward primers were designed, each specific to a single functional Vβ segment or a small family of Vβ segments. The 3′ end of each Vβ forward primer is anchored at position −43 in the Vβ segment, relative to the recombination signal sequence, thereby providing a unique Vβ tag sequence within the amplified region. Vβ forward primers were designed for all known nonpseudogenes in the TCRβ locus. The 13 reverse primers specific to each Jβ segment are anchored in the 3′ intron, with the 3′ end of each primer crossing the intron/exon junction. The Jβ reverse primers were designed to be anchored at their 3′ ends on a consensus splice site motif to minimize overlap with the sequencing primers. Thirteen sequencing primers were designed that are complementary to the amplified portion of the Jβ segment, such that the first few bases of sequence generated will capture the unique Jβ tag sequence. The sequencing primers were designed so that promiscuous priming of a sequencing reaction for one J segment by a primer specific to another J segment would generate sequence data starting at exactly the same nucleotide as sequence data from the correct sequencing primer.
The PCR product for a TCRβ CDR3 region generated by this approach is approximately 200 bp. Genomic templates were amplified using an equimolar pool of the 45 TCR Vβ F primers (the “VF pool”) and an equimolar pool of the 13 TCR Jβ R primers (the “JR pool”). PCRs (50 μL) were set up at 1.0 μM VF pool (22 nM for each unique TCR Vβ F primer), 1.0 μM JR pool (77 nM for each unique TCRBJR primer), 1 × QIAGEN Multiplex PCR master mix (QIAGEN part number 206145), 10% Q-solution (QIAGEN), and 16 ng/μL gDNA. The following thermal cycling conditions were used in a PCR Express thermal cycler (Hybaid): 1 cycle at 95°C for 15 minutes, 25 to 40 cycles at 94°C for 30 seconds, 59°C for 30 seconds, and 72°C for 1 minute, followed by 1 cycle at 72°C for 10 minutes. To sample millions of rearranged TCRβ CDR3 loci, 12 to 20 wells of PCR were performed for each library.
Preprocessing of Genome Analyzer sequence data
Raw GA sequence data were preprocessed to remove errors in the primary sequence of each read, and to compress the data. Approximately 20% of the sequences from the Genome Analyzer were technical failures, and were removed by a complexity filter. Each sequence was required to have a minimum of a 6-nt match to one of the 45 Vβ gene segments and one of the 13 Jβ gene segments. One sequence in 5 × 10⁶ obtained from control lanes containing ϕX174 sequence satisfied these criteria, demonstrating that false-positive sequences are rare. Finally, a nearest neighbor algorithm was used to collapse the data into unique sequences by merging closely related sequences, to remove both PCR error and GA sequencing error (details in supplemental Document 1).
Identification of CDR3 length and reading frame
The TCRβ CDR3 region as defined by the IMGT collaboration8 begins with the second conserved cysteine encoded by the 3′ portion of the Vβ gene segment and ends with the conserved phenylalanine encoded by the 5′ portion of the Jβ gene segment. The number of nucleotides between these codons determines the length and therefore the frame of the CDR3 region.
Estimating relative CDR3 sequence abundance in blood
The observed relative abundance of each TCRβ CDR3 sequence in the GA output is influenced by 4 distinct processes: the sampling of T cells from blood, their sorting by flow cytometry, PCR amplification of the rearranged TCRβ CDR3 regions from sorted T-cell genomes, and sequencing of the PCR products. The relative abundances of CDR3 sequences in the library of PCR products were inferred from the sequence data, and an expectation maximization method was then used to reconstruct the distribution of CDR3 sequences in the blood (details in supplemental Document 1).
Unseen species model for estimation of CDR3 sequence diversity
To estimate the total number of unique TCRβ CDR3 sequences present in the blood based on the number of unique sequences observed in a small blood sample, a computational approach developed by Fisher et al4 and subsequently extended by other investigators5 was used. Calculating the diversity of TCRβ CDR3 sequences in the T-cell repertoire is analogous to a classical problem in animal ecology known as the unseen species problem, the challenge of which is to estimate the number of unique species in a large, complex population based on the number of unique species observed in a random, finite sample. Fisher et al and subsequent investigators4,5 developed an analytic solution to the unseen species problem that can readily be used to estimate the diversity of molecular species in a complex population, such as the number of genetic variants in the human genome.9 The key to this solution is an expression that predicts the number of “new” species that would be observed if a second random, finite sample from the same population—identical in size to the first sample—was to be analyzed. In this study, a “species” corresponds to a specific TCRβ CDR3 sequence. The total number of unseen species, or CDR3 sequences, then, is the number of new TCRβ CDR3 sequences that would be detected if the experiment were repeated an infinite number of times. The main assumption required is that T cells circulate freely in the blood.
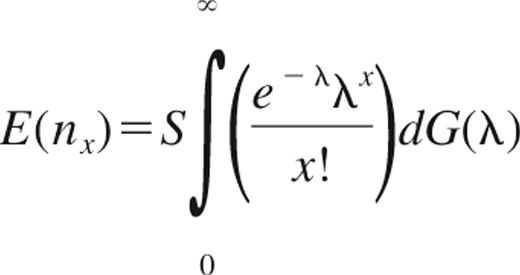
If the total number of TCRβ CDR3 sequences in the repertoire is defined as S, suppose that a sequencing experiment observes xs copies of sequence s. For all of the unobserved CDR3 sequences, xs equals 0. Further, suppose that each CDR3 sequence is “captured” in a blood draw according to a Poisson process with parameter λs, which is a valid assumption as long as the volume of blood sampled is a small fraction of the total blood volume. The number of T-cell genomes sequenced in the first blood sample is defined as 1, and the number sequenced from a second blood sample, as t (the case t = 1 implies that the samples are of equal size).
Because there are a large number of unique sequences, an integral is used instead of a sum. If G(λ) is the empiric distribution function of the parameters, λ1, …, λS, and nx is the number of CDR3 sequences observed exactly x times, then
The number of new CDR3 sequences observed in the second blood sample, Δ(t), is
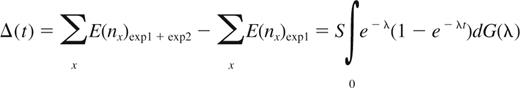
Taylor expansion of 1 − e−λt, and substitution into the expression for Δ(t), yields

which can be approximated by replacing the expectations (E(nx)) with the actual numbers of sequences observed exactly x times in the first blood sample. The expression for Δ(t) oscillates widely as t goes to infinity, however, so to produce a lower bound for Δ(∞), Δ(t) needs to be regularized. There are many known methods to accomplish this, and the Euler transformation was used in this study.5
TCRβ-chain spectratyping
Results
Sample preparation, sequencing, and error correction
Peripheral blood T lymphocytes from 2 healthy, cytomegalovirus-seronegative male donors were isolated and sorted to a median of 99% purity by flow cytometry into 4 populations: CD4+CD45RO+, CD4+CD45RO−, CD8+CD45RO+, and CD8+CD45RO− (see “Methods” and supplemental Table 1 for experimental details). Genomic DNA was extracted from the sorted cells, and the rearranged TCRβ CDR3 regions were amplified using multiplex PCR and sequenced using the Illumina Genome Analyzer (GA) system. Recent technical enhancements to the GA, implemented while this study was in progress, increased the maximum sequence read length from approximately 36 to 54 nucleotides. Accordingly, the terms GA1 and GA2 are used to designate the Genome Analyzer used for these studies before and after, respectively, these technical upgrades were implemented. All sequencing experiments for this study used a single-flow cell or “chip” that contained 8 discrete lanes, with one lane per chip reserved for sequencing of the ϕX174 genome for quality-control purposes. Each experimental lane on the GA1, after preprocessing of the data (described in supplemental Document 1), produced from 1 to 3 × 10⁶ in-frame TCRβ CDR3 sequences, for which the contributing J and V gene segments could be reliably identified, and each lane on the GA2 produced from 3 to 5 × 10⁶ such reads.
Errors in the primary sequencing data were derived primarily from 2 sources: (1) nucleotide misincorporation that occurred during the PCR amplification of TCRβ CDR3 template sequences, and (2) errors in base calls introduced by the GA during sequencing of the PCR-amplified library of CDR3 sequences. The large quantity of data allowed us to implement a straightforward error-correcting code to correct most of the errors in the primary sequence data that were attributable to these 2 sources (supplemental Document 1). After error correction, the number of unique, in-frame CDR3 sequences and the number of observations of each unique sequence were tabulated for each of the 4 flow-sorted T-cell populations from the 2 donors. The relative frequency distribution of CDR3 sequences in the 4 flow cytometrically defined populations demonstrated, as expected, that antigen-experienced CD45RO+ populations contained significantly more unique CDR3 sequences with high relative frequency than the CD45RO− populations (representative data from one donor in Figure 2).

Observed TCRβ CDR3 sequence copy number per 5 mL whole blood. Frequency histograms of TCRβ CDR3 sequences observed in 4 different T-cell subsets distinguished by expression of CD4, CD8, and CD45RO and present in 5 mL blood of one male donor. For example, the square at 200,10 means that 10 unique sequences were each observed 200 times in the CD4+CD45RO+ (antigen-experienced) T-cell sample. The data were resampled from the sequences generated by the Genome Analyzer to approximate the expected CDR3 sequence distribution in the T cells present in 5 mL blood, as determined by flow cytometry. A small set of sequences found in the CD45RO+ compartments were found with very large copy number (> 10 000 copies) but are not displayed.
Observed TCRβ CDR3 sequence copy number per 5 mL whole blood. Frequency histograms of TCRβ CDR3 sequences observed in 4 different T-cell subsets distinguished by expression of CD4, CD8, and CD45RO and present in 5 mL blood of one male donor. For example, the square at 200,10 means that 10 unique sequences were each observed 200 times in the CD4+CD45RO+ (antigen-experienced) T-cell sample. The data were resampled from the sequences generated by the Genome Analyzer to approximate the expected CDR3 sequence distribution in the T cells present in 5 mL blood, as determined by flow cytometry. A small set of sequences found in the CD45RO+ compartments were found with very large copy number (> 10 000 copies) but are not displayed.
PCR bias assessment
A major objective of these studies was to determine not only the number of unique TCRβ CDR3 sequences, but also to determine the relative abundance of these sequences. It was anticipated that the use of a PCR step to amplify the TCRβ CDR3 regions before sequencing could potentially introduce a systematic bias in the inferred relative abundance of the sequences, due to differences in the efficiency of PCR amplification of CDR3 regions using different Vβ and Jβ gene segments. To estimate the magnitude of any such bias, the TCRβ CDR3 regions from a sample of approximately 30 000 unique CD4+CD45RO+ T-lymphocyte genomes were amplified through 25 PCR cycles, at which point the PCR product was split in half. Half was set aside, and the other half was amplified for an additional 15 cycles, for a total of 40 cycles of amplification. The PCR products amplified through 25 and 40 cycles were then sequenced in different lanes of a GA1 flow cell.
Of the 30 000 unique TCRβ CDR3 sequences observed in the 25-cycle PCR lane, 97% were also found in the 40-cycle PCR lane. Plotting the number of observations of these 30 000 sequences in the 25-cycle lane against the number of observations in the 40-cycle lane, a linear correlation was observed (Figure 3). For sequences observed a given number of times in the 25-cycle lane, a combination of PCR bias and sampling variance accounts for the variance around the mean of the number of observations at 40 cycles. Conservatively attributing the mean variation about the line (1.5-fold) entirely to PCR bias, each cycle of PCR amplification potentially introduces a bias of average magnitude 1.51/15 = 1.027. Thus, the 25 cycles of PCR currently used in our protocol for preparing CDR3 regions for GA sequencing potentially introduces a total bias of average magnitude 1.02725 = 1.95 in the inferred relative abundance of distinct CDR3 region sequences.

Assessment of PCR bias. The rearranged TCRβ CDR3 regions present in approximately 30 000 T-cell genomes were amplified through 25 cycles of PCR, and the PCR products were split into 2 pools. One pool was amplified an additional 15 cycles, and then the PCR products from the 25-cycle and 40-cycle reactions were sequenced in separate lanes of a GA1 flow cell. Of the TCRβ CDR3 sequences observed in the 25-cycle PCR lane, 97% were also observed in the 40-cycle PCR lane. Each point on the graph represents a single unique CDR3 sequence, plotted according to the number of times that sequence was observed in the data from 25-cycle (abscissa) and 40-cycle (ordinate) PCR reactions, respectively. The density of sequences at each point in the plot is indicated by color, with purple the highest density and red the lowest. The solid line represents a linear regression of the data, and the dotted lines 1 SD above and below the mean.
Assessment of PCR bias. The rearranged TCRβ CDR3 regions present in approximately 30 000 T-cell genomes were amplified through 25 cycles of PCR, and the PCR products were split into 2 pools. One pool was amplified an additional 15 cycles, and then the PCR products from the 25-cycle and 40-cycle reactions were sequenced in separate lanes of a GA1 flow cell. Of the TCRβ CDR3 sequences observed in the 25-cycle PCR lane, 97% were also observed in the 40-cycle PCR lane. Each point on the graph represents a single unique CDR3 sequence, plotted according to the number of times that sequence was observed in the data from 25-cycle (abscissa) and 40-cycle (ordinate) PCR reactions, respectively. The density of sequences at each point in the plot is indicated by color, with purple the highest density and red the lowest. The solid line represents a linear regression of the data, and the dotted lines 1 SD above and below the mean.
Jβ gene segment usage
The CDR3 region in each TCRβ chain includes sequence derived from one of the 13 Jβ gene segments. Analysis of the CDR3 sequences in the 4 different T-cell populations from the 2 male donors demonstrated that the fraction of total sequences that incorporated sequences derived from the 13 different Jβ gene segments varied more than 20-fold (Figure 4). The Jβ gene segment usage pattern observed in the 4 different T-cell populations was relatively constant within a given donor. Moreover, the Jβ usage patterns observed in the 2 healthy male donors, which were inferred from analysis of genomic DNA from T cells sequenced using the GA, are qualitatively similar to those observed in T cells from umbilical cord blood12,13 and from healthy adult donors,14 both of which were inferred from analysis of cDNA from T cells sequenced using exhaustive capillary-based techniques.

Jβgene segment use in 4 different T-cell compartments. Jβ gene segment use of TCRβ CDR3 sequences observed in the 4 different flow cytometrically defined T-cell compartments from donor 1.
Jβgene segment use in 4 different T-cell compartments. Jβ gene segment use of TCRβ CDR3 sequences observed in the 4 different flow cytometrically defined T-cell compartments from donor 1.
Nucleotide insertion bias
Much of the diversity in the CDR3 regions of the TCRα and β chains is thought to be created by template-independent insertion of nucleotides at the Vβ-Dβ and Dβ-Jβ junctions by terminal deoxynucleotidyl transferase (Tdt).15 The frequency with which Tdt inserts each of the 4 nucleotides has been studied in murine cell lines.16 Estimation of these frequencies from analysis of TCRβ CDR3 sequences expressed in T cells is complicated by the fact that both positive and negative selection on the resulting protein sequences plays a significant role in shaping the TCR repertoire. However, the nucleotide insertion frequencies can be estimated without the confounding effects of selection by analyzing the nucleotide content of the Vβ-Dβ and Dβ-Jβ junctions in nonproductively rearranged TCRβ alleles, that is, rearranged TCRβ alleles that generate an out-of-frame transcript. Analysis of junctional nucleotides in these alleles revealed that Tdt is biased toward insertion of C and G over A and T (Table 1 “Out-of-frame insertions”). Similar nucleotide frequencies were observed in CDR3 sequences that generated in-frame transcripts (Table 1 “In-frame insertions”).
Tdt Mononucleotide insertion bias
| Mononucleotide frequencies | A | C | G | T |
|---|---|---|---|---|
| Out-of-frame insertions* | ||||
| CD4+CD45RO− | 0.24 | 0.294 | 0.247 | 0.216 |
| CD4+CD45RO+ | 0.247 | 0.284 | 0.256 | 0.211 |
| CD8+CD45RO− | 0.25 | 0.27 | 0.268 | 0.209 |
| CD8+CD45RO+ | 0.255 | 0.293 | 0.24 | 0.21 |
| In-frame insertions† | ||||
| CD4+CD45RO− | 0.21 | 0.285 | 0.275 | 0.228 |
| CD4+CD45RO+ | 0.216 | 0.281 | 0.266 | 0.235 |
| CD8+CD45RO− | 0.222 | 0.266 | 0.288 | 0.221 |
| CD8+CD45RO+ | 0.206 | 0.294 | 0.228 | 0.27 |
Mononucleotide frequencies in the inserted junctional nucleotides at the Vβ -Dβ and Dβ -Jβ junctions, computed from the nonproductive, out-of-frame CDR3 sequences, in the CD4+CD45RO+/− and CD8+CD45RO+/− compartments.
Mononucleotide frequencies in the inserted junctional nucleotides in the productive, in-frame CDR3 sequences.
High-frequency TCRβ CDR3 sequences are closer to germline
The frequencies of different CDR3 sequences in each T-cell compartment studied varied more than 10 000-fold. The characteristics of the CDR3 sequences observed in each of the T-cell compartments of the 2 donors were analyzed to determine whether one or more features, such as length, GC content, J usage, V usage, or number of junctional nucleotides inserted or deleted, were correlated with the variation in observed frequency. This analysis revealed that the number of insertions and deletions at the Vβ-Dβ and Dβ-Jβ junctions were the features that were most closely correlated with frequency, and demonstrated an inverse correlation (Figures 5A-B). CDR3 sequences with fewer insertions and deletions have receptor sequences that are closer to the germline sequence.

Relative abundance of unique TCRβ CDR3 sequences correlates inversely with divergence from germline. (A) Observed frequency (top panels) and average observed frequency (bottom panels) of TCRβ CDR3 sequences in the CD8+CD45RO+/− and CD4+CD45RO+/− T-cell compartments of 2 male donors plotted, from left to right, according to their Jβ and Vβ gene segment use, CDR3 length, and total number of (inserted + deleted) nucleotides at the Vβ-Dβ and Dβ-Jβ junctions. (B) Heat map representation of relative abundance of TCRβ CDR3 sequences observed in CD4+ naive, CD4+ memory, and CD8+ naive T-cell compartments of the 2 male donors arrayed according to the number of nucleotides deleted or inserted at the Vβ-Dβ and Dβ-Jβ junctions. Color indicates the log10(observed frequency) of the sequences with the indicated number of inserted or deleted junctional nucleotides.
Relative abundance of unique TCRβ CDR3 sequences correlates inversely with divergence from germline. (A) Observed frequency (top panels) and average observed frequency (bottom panels) of TCRβ CDR3 sequences in the CD8+CD45RO+/− and CD4+CD45RO+/− T-cell compartments of 2 male donors plotted, from left to right, according to their Jβ and Vβ gene segment use, CDR3 length, and total number of (inserted + deleted) nucleotides at the Vβ-Dβ and Dβ-Jβ junctions. (B) Heat map representation of relative abundance of TCRβ CDR3 sequences observed in CD4+ naive, CD4+ memory, and CD8+ naive T-cell compartments of the 2 male donors arrayed according to the number of nucleotides deleted or inserted at the Vβ-Dβ and Dβ-Jβ junctions. Color indicates the log10(observed frequency) of the sequences with the indicated number of inserted or deleted junctional nucleotides.
“Spectratype” analysis of TCRβ CDR3 sequences by Vβ gene segment use and CDR3 length
TCRβ-chain CDR3 diversity has commonly been assessed using the technique of TCR spectratyping.17-21 The spectratypes of polyclonal T-cell populations with diverse repertoires of TCR CDR3 sequences, such as are seen in umbilical cord blood12,13 or in the peripheral blood of healthy young adults,18,19 typically contain CDR3 sequences of 8 to 10 different lengths that are multiples of 3 nucleotides, reflecting the selection for in-frame transcripts. To assess whether direct sequencing of TCRβ CDR3 regions from T-cell genomic DNA using the GA could faithfully capture all of the CDR3 length diversity that is identified by spectratyping, “virtual” TCRβ spectratypes—histograms of the number of TCRβ CDR3 sequences using specific Vβ gene segments and sorted according to CDR3 length—were generated from the GA sequence data and compared with TCRβ spectratypes generated using conventional PCR techniques. The virtual spectratypes contained all of the CDR3 length and relative frequency information present in the conventional spectratypes (representative data in Figure 6A-B). In addition, the virtual spectratypes revealed the presence within each Vβ family of rare CDR3 sequences with both very short and very long CDR3 lengths that were not detected by conventional PCR-based spectratyping.

Direct TCRβ CDR3 sequencing captures all of the TCR diversity information present in a conventional spectratype. (A) Comparison of standard TCRβ spectratype data and calculated TCRβ CDR3 length distributions for sequences using representative TCR Vβ gene segments and present in CD4+CD45RO+ cells from male donor 1. CDR3 length is plotted along the x-axis and the number of unique CDR3 sequences with that length (GA sequence data) or the relative intensity of the corresponding peak in the spectratype is plotted along the y-axis. Reducing the information contained in the GA sequence data to a frequency histogram of the unique CDR3 sequences with different lengths within each Vβ family readily reproduces all of the information contained in the spectratype data. The length of the differently colored segments within each bar of the histograms indicates the fraction of unique CDR3 sequences that were observed 1 to 5 times (black), 6 to 10 times (blue), 11 to 100 times (green), or more than 100 times (red). (B) A representative “virtual spectratype” of TCRβ CDR3 sequences extracted from CD4+CD45RO+ T cells from donor 1 that use the Vβ10 gene segment. The CDR3 sequences using Vβ10 were sorted by CDR3 length into a frequency histogram, and the sequences within each length bin were then color-coded on the basis of their Jβ use. The inset shows all of the CDR3 sequences using Vβ10 and Jβ2-6, and having a length of 39 nt, as well as the number of times that each of these sequences was observed in the data. The origin of the nucleotides in each sequence is color-coded as follows: Vβ gene segment, red; template-independent N nucleotide, black; Dβ gene segment, blue; Jβ gene segment, green.
Direct TCRβ CDR3 sequencing captures all of the TCR diversity information present in a conventional spectratype. (A) Comparison of standard TCRβ spectratype data and calculated TCRβ CDR3 length distributions for sequences using representative TCR Vβ gene segments and present in CD4+CD45RO+ cells from male donor 1. CDR3 length is plotted along the x-axis and the number of unique CDR3 sequences with that length (GA sequence data) or the relative intensity of the corresponding peak in the spectratype is plotted along the y-axis. Reducing the information contained in the GA sequence data to a frequency histogram of the unique CDR3 sequences with different lengths within each Vβ family readily reproduces all of the information contained in the spectratype data. The length of the differently colored segments within each bar of the histograms indicates the fraction of unique CDR3 sequences that were observed 1 to 5 times (black), 6 to 10 times (blue), 11 to 100 times (green), or more than 100 times (red). (B) A representative “virtual spectratype” of TCRβ CDR3 sequences extracted from CD4+CD45RO+ T cells from donor 1 that use the Vβ10 gene segment. The CDR3 sequences using Vβ10 were sorted by CDR3 length into a frequency histogram, and the sequences within each length bin were then color-coded on the basis of their Jβ use. The inset shows all of the CDR3 sequences using Vβ10 and Jβ2-6, and having a length of 39 nt, as well as the number of times that each of these sequences was observed in the data. The origin of the nucleotides in each sequence is color-coded as follows: Vβ gene segment, red; template-independent N nucleotide, black; Dβ gene segment, blue; Jβ gene segment, green.
Estimation of total TCRβ CDR3 sequence diversity
After error correction, the number of unique CDR3 sequences observed in each lane of the GA flow cell routinely exceeded 105. Given that the PCR products sequenced in each lane were necessarily derived from a small fraction of the T-cell genomes present in each of the 2 donors, the total number of unique TCRβ CDR3 sequences in the entire T-cell repertoire of each person is likely to be far higher. Estimating the number of unique sequences in the entire repertoire, therefore, requires an estimate of the number of additional unique CDR3 sequences that exist in the blood but were not observed in the sample. This is an example of the unseen species problem, a classic problem in animal ecology in which the challenge is to estimate the total species diversity in a large, complex population using measurements of the species diversity present in a random, finite sample, in which TCRβ CDR3 sequences can be viewed as the “species” and the αβ T-cell repertoire can be viewed as the “population.” An analytic solution to the unseen species problem was developed by Fisher et al4 and subsequently extended by other investigators,5 and has recently been used to estimate the number of genetic variants in the human genome.9 The applicability of this analytic solution to the estimation of TCRβ CDR3 sequences in the entire T-cell repertoire was tested experimentally by using it to predict the number of new TCRβ CDR3 sequences that would be observed in the second of 2 identical blood samples, based on the number and relative abundance of unique CDR3 sequences observed in the first blood sample, and then comparing the predicted number with the actual number of new CDR3 sequences observed when the second sample is sequenced. The predicted and actual numbers of new, unique TCRβ CDR3 sequences observed in the second sample were 1.6 × 10⁵ and 1.76 × 10⁵, respectively, demonstrating that the solution developed by Fisher et al4 provides a reasonable estimate of the total diversity of TCRβ CDR3 sequences in the repertoire.
The sum of the calculated number of unique TCRβ CDR3 sequences from the 4 flow cytometrically defined T-cell compartments in the peripheral blood of the 2 healthy male donors is 3 to 4 million (Table 2). Surprisingly, the CD45RO+, or antigen-experienced, compartment comprises approximately 1.5 million of these sequences. The estimated TCRβ CDR3 repertoire sizes of each compartment in the 2 healthy male donors are within 20% of each other.
TCRβ CDR3 repertoire diversity
| Donor | CD8 | CD4 | CD45RO | Diversity | GA |
|---|---|---|---|---|---|
| 1 | + | − | + | 6.3 × 10⁵ ± 9 × 10⁴ | 2 |
| 1 | + | − | − | 1.24 × 10⁶ ± 5 × 10⁴ | 2 |
| 1 | − | + | + | 8.2 × 10⁵ ± 4 × 10⁴ | 2 |
| 1 | − | + | − | 1.28 × 10⁶ ± 1.3 × 10⁵ | 2 |
| 2 | + | − | + | 4.4 × 10⁵ ± 1.1 × 10⁵ | 1 |
| 2 | + | − | − | 9.7 × 10⁵ ± 1.3 × 10⁵ | 1 |
| 2 | − | + | + | 8.7 × 10⁵ ± 1.2 × 10⁵ | 2 |
| 2 | − | + | − | 1.03 × 10⁶ ± 8 × 10⁴ | 2 |
Lower bounds on the number of unique TCRβ CDR3 sequences in the CD8+CD45RO+/− and CD4+CD45RO+/− T cell compartments in two young, healthy, CMV-seronegative adult males were calculated using an analytic solution to the ″unseen species problem″ (see “Methods”). GA1 and GA2 indicate whether the sequence data were obtained before (GA1) or after (GA2) the implementation of technical enhancements to the Illumina Genome Analyzer that increased the maximum sequence read length from ∼ 36 to ∼ 54 nucleotides.
Discussion
The adaptive immune system can theoretically generate an enormous diversity of T-cell receptor CDR3 sequences—far more than are likely to be expressed in any one person at any one time.22 Previous attempts to measure what fraction of this theoretic diversity is actually used in the adult αβ T-cell repertoire, however, have been limited by the difficulties inherent in using standard capillary electrophoresis-based sequencing technologies to sequence the CDR3 repertoire with sufficient depth to accurately assess the diversity. Here we describe the development of a novel approach to this question that is based on single-molecule DNA sequencing and an analytic computational approach to the estimation of repertoire diversity using diversity measurements in finite samples. Our analysis demonstrates that the number of unique TCRβ CDR3 sequences in the adult repertoire significantly exceeds previous estimates based on exhaustive capillary sequencing of small segments of the repertoire. The TCRβ-chain diversity in the CD45RO− population (enriched for naive T cells) observed using our method is 3- to 4-fold larger than previously reported.2 However, the most striking difference between the current and previously published results is observed in the number of unique TCRβ CDR3 sequences expressed in antigen-experienced CD45RO+ T cells—our results suggest that this number is between 10 and 20 times larger than previously reported.2 The frequency distribution of CDR3 sequences in CD45RO+ cells is notable for the significant number of sequences that were observed with low copy counts, suggesting that the αβ CD45RO+ T-cell repertoire contains a large number of clones with a small clone size. The existence of this segment of the CD45RO+ repertoire has been suggested by previous studies, performed using standard capillary sequencing, of pathogen-specific components of the T-cell repertoire,23 but the generality of this finding has not previously been fully appreciated.
Our data suggest that the realized set of TCRβ chains are sampled nonuniformly from the huge potential space of sequences. In particular, the β-chain sequences that more closely resemble the germline (few insertions and deletions at the Vβ-Dβ and Dβ-Jβ junctions) appear to be created at a relatively high frequency. One possible explanation for the increased frequency of sequences that are more closely related to the germline sequence is that they are created multiple times during T-cell development.24 Moreover, since the germline sequence for the Vβ, Dβ, and Jβ gene segments is shared, except for a small number of polymorphisms, among the human population, TCR sequences close to germline are likely to be shared among different persons.24,25 Indeed, more than 1% of the amino acid sequences encoded by the TCRβ CDR3 nucleotide sequences observed in donors 1 and 2 are observed in both of these persons (H.S.R., unpublished observations, February 2009). The significance of this observation is currently being explored in a larger sample of subjects.
The deep-sequencing approach to assessment of the TCRβ CDR3 repertoire that is discussed in this report represents a significant advance over previous methodologies, such as TCRβ-chain spectratyping, for evaluating TCRβ CDR3 diversity and assessing the clonal composition of populations of αβ T cells. Spectratyping does not assess TCR CDR3 diversity at the sequence level, but rather measures the diversity of TCRα or TCRβ third complementarity-determining region (CDR3) lengths in subsets of αβ T cells that use a specific Vα or Vβ gene segment. The spectratyping technique cannot directly determine the number of distinct TCRs in a population of αβ T cells, nor can it provide information about the relative frequency of each receptor in the population. The molecular and computational approach described in this report not only enables accurate estimation of the number of distinct antigen receptors in any defined population of lymphocytes, but also provides information about the relative abundance of cells with each receptor. As the cost of high-throughput sequencing using the Illumina Genome Analyzer and other platforms declines, it is anticipated that direct high-throughput sequencing of the TCRβ CDR3 repertoire will replace spectratyping as the methodology of choice for assessing the clonal composition of T-cell populations.
The T-cell receptors expressed by mature αβ T cells are heterodimers whose 2 constituent chains are generated by independent rearrangement events of the TCRα and β variable loci. The theoretic diversity of T-cell receptors that can be generated is thus significantly increased by the potential to construct an αβ heterodimer by pairing any one of a large number of distinct α chains with any one of a large number of distinct β chains. It has been estimated that each unique TCRβ chain expressed in the CD45RO− T-cell compartment is on average paired with 25 different TCRα chains, and that each TCRβ chain in the CD45RO+ compartment is paired with a single TCRα chain.2 We believe that our strategy for assessment of TCRβ CDR3 diversity can readily be adapted to the assessment of TCRα diversity, as well as to the assessment of CDR3 diversity in the immunoglobulin repertoire. However, determining the number of unique TCRαβ combinations in the entire T-cell repertoire will require the development of techniques for covalently linking the α- and β-chain CDR3 regions expressed in each individual T cell into a single DNA template for subsequent sequencing. The development of molecular strategies for accomplishing this task is the focus of our current research.
The methods described in this report should prove of great utility for the assessment of immune reconstitution after allogeneic hematopoietic cell transplantation10,19,26,27 and of lymphocyte diversity in other states of congenital or acquired immunodeficiency. For example, little is known about the relationship between αβ TCR repertoire diversity and pathogen resistance, and it is not even known whether there is a minimal level of repertoire diversity required for protection against the spectrum of commonly encountered pathogens.28 These techniques should also greatly enhance the analysis of how lymphocyte diversity declines with age,29,30 which has been difficult to assess due to the lack of accurate methods for assessing TCR diversity, and should also permit comprehensive definition of the process by which the T-cell repertoire, and in particular the CD8+ compartment, becomes progressively oligoclonal with age.18 These techniques will prove critical to the rational evaluation of investigational therapeutic agents such as interleukin-7 that have a direct effect on the generation, growth, and development of αβ T cells.31 Moreover, application of these techniques to the study of thymic T-cell populations could provide valuable insight into the processes of both T-cell receptor gene rearrangement as well as positive and negative selection of thymocytes.
The online version of this article contains a data supplement.
The publication costs of this article were defrayed in part by page charge payment. Therefore, and solely to indicate this fact, this article is hereby marked “advertisement” in accordance with 18 USC section 1734.
Acknowledgments
H.S.R. thanks Walter Ruzzo, Martin McIntosh, Tim Randolph, and Phil Bradley for useful discussions.
The authors gratefully acknowledge support for this work provided by Bob and Pat Herbold, the Thomsen Family Fellowship, and National Institutes of Health (NIH) grants CA015704, DK056465, CA106512, and CA18029. The funders had no role in study design, data collection and analysis, decision to publish, or preparation of the paper.
National Institutes of Health
Authorship
Contribution: P.V.C., C.J.T., and O.K. performed experiments; H.S.R., P.V.C., S.K.S., A.W., and C.S.C. analyzed results and made the figures; H.S.R., P.V.C., E.H.W., S.R.R., and C.S.C. designed the research; and H.S.R., C.S.C., and E.H.W. wrote the paper. All authors read and edited the paper.
Conflict-of-interest disclosure: The authors declare no competing financial interests.
Correspondence: Harlan S. Robins, Computational Biology Program, Public Health Sciences Division, Fred Hutchinson Cancer Research Center, 1100 Fairview Ave N, Seattle, WA 98109-1024; e-mail: hrobins@fhcrc.org.
