Abstract
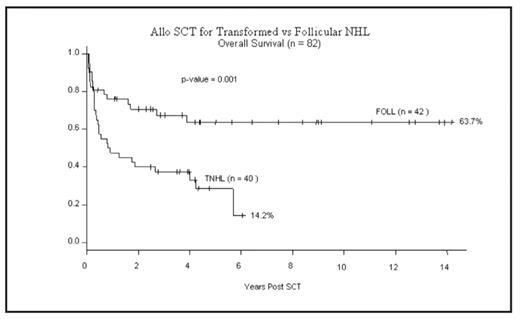
We compared the outcome of patients who received myeloablative allogeneic stem cell transplantation for relapsed follicular and transformed non-Hodgkin lymphoma (1998– 2006). Data were prospectively entered into computerized Leukemia/BMT and BCCA databases. We hypothesized that outcome would be superior for patients proceding to SCT prior to transformation. This is a large, single-institution, population-based comparative cohort study. Forty consecutive patients (49%) have transformed or composite lymphoma and 42 (51%) follicular lymphoma. There were no significant differences between baseline characteristics at diagnosis for the 2 groups including median age, gender, stage, B symptoms, ECOG performance status, IPI, response to primary treatment or at stem cell transplant including age, number of prior therapies, conditioning regimen, prior rituximab therapy, donor type (sibling vs unrelated), or cytomegalovirus serology status of donor and recipient. Twenty eight of 42 patients (67%) with follicular lymphoma and 11 of 40 (28%) with transformed lymphoma are alive with median follow-up for the whole group at 26 months (range: 1–127 m). Overall (OS) and event-free survival (EFS) are superior for the follicular compared to the transformed lymphoma group mainly due to a lower relapse rate. The 2- and 5-year OS for the follicular and transformed groups are 71% vs 40% and 64% vs 28% respectively, (p=0.001). The 2- and 5-year EFS for the follicular and transformed groups are 71 vs 35% and 64 vs 27% respectively, (p<0.001). The cumulative incidence of disease relapse at 1- and 5-years post allogeneic stem cell transplantation for the follicular and transformed groups are 2% vs 23% and 2% vs 36% respectively, (p<0.001). Treatment related mortality (TRM) was comparable with 1- and 5-year cumulative incidence of TRM at 22 vs 35% and 34 vs 38% for the follicular and transformed groups respectively, (p=0.39). Early complications post-allogeneic stem cell transplantation (Bearman toxicity criteria) were similar in both groups. The risk of acute graft host disease (aGvHD) all grades was similar in both groups with a cumulative incidence of 68.8% and 60% at day 100 for the follicular and transformed groups respectively (p=0.40). The cumulative incidence of severe aGvHD grades III/IV was also similar in both groups, (p=0.32). However the cumulative incidence of chronic GvHD (cGvHD) at 2-years was significantly higher in the follicular (63.5%) compared to the transformed group (26.7%) (p=0.01). This may suggest that the lower relapse rate seen with follicular lymphoma is due to graft versus lymphoma effect associated with the higher risk of cGvHD observed in the follicular group. In summary, allogeneic stem cell transplantation results in good long term survival rates for patients with refractory and relapsed follicular lymphoma but poor outcome is observed for those proceding to allograft after transformation. Patients with high risk follicular lymphoma and those at high risk for transformation should be offered allogeneic stem cell transplantation ideally before transformation occurs.
Table: Basic characteristics of follicular and transformed groups.
| Parameter . | TNHL (%) . | Follicular NHL (%) . | P-Value . |
|---|---|---|---|
| Number of patients | 40 (49) | 42 (51) | 0.912 (Ho: porp=0.88) |
| Gender: Male/Female; Ratio | 27/13 (67.5/32.5); 2/1 | 23/19 (55/45); 1:1 | Chi-squared test: 0.24 |
| Age (years): Median / Range | 44 / 28 – 58 | 45 / 20 – 61 | t test (equal means): 0.20 |
| Donor Type: Sibling/ unrelated | 25 / 15 (62.5 / 37.5) | 28 / 14 (81 / 19) | Chi-squared test: 0.69 |
| Stage: * | Fisher test: 0.54 | ||
| I/II/III/VI | 2/2/6/30 (5/5/15/75) | 1/6/7/27 (2/15/17/66) | |
| IPI (number of factors)(0–1 vs 2–5) * | Fisher test: 0.47 | ||
| 0/1 | 5/13 (12.5/32.5) | 6/16 (18/47) | |
| 2/3 | 15/5 (37.5/12.5) | 9/3 (26/9) | |
| 4/5 | 2/0 (5/0) | 0/0 (0/0) | |
Figure
Disclosures: No relevant conflicts of interest to declare.
Author notes
Corresponding author


This feature is available to Subscribers Only
Sign In or Create an Account Close Modal