Abstract
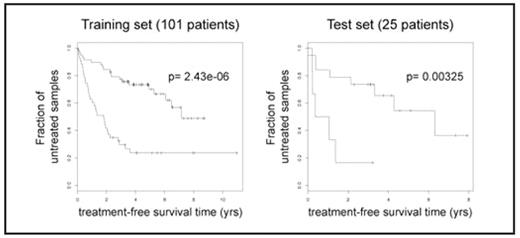
The clinical course of patients with chronic lymphocytic leukemia (CLL) is heterogeneous. Several prognostic factors have been identified that can stratify patients into groups that differ in their relative tedancy for disease progression and/or survival. Microarray studies have highlighted differences in mRNA levels found between such CLL subgroups. We hypothesize that gene expression profiling might define a repertoire of transcriptional activity contributing to or resulting from the dynamic evolution of CLL cells. To evaluate for this, we profiled approximately 200 CLL patients (of >95% CD19+CD5+ peripheral blood mononuclear cells in each sample) on mRNA expression microarrays using Affymetrix HG-U133 plus 2 GeneChips. We first sought to develop an expression-based prognosis that assigns patients to “aggressive” (high-risk) or “indolent” (low-risk) groups based on their gene expression correlated to the treatment-free survival from the date of sample collection. Each of the ~22,000 genes was scored by the Cox metric, which measures the correlation between its gene expression level and treatment-free survival in a designated training set. Unsupervised 2-means clustering technique was then used to separate the training samples into two risk groups based on the similarity of their mRNA expression of the top Cox-scored genes. Patients in an independent test set were assigned to the “aggressive” or “indolent” groups based on their expression similarity to that of the training samples. The two risk groups defined by the gene signature displayed significantly different behaviors with respect to treatment-free survival (Fig. 1); however, neither of the two commonly-used prognostic factors, IgVH gene mutational status or leukemia-cell expression of ZAP-70 protein, could segregate these subgroups to the same degree of statistical significance. To achieve better prediction performance based upon biological-defendable models, we further adopted the network-based classification scheme we previously developed for predicting metastasis potential of breast cancers. The network-based approach identified prognostic markers not as individual genes but as subnetworks extracted from molecular interaction databases. Gene expression profiles from CLL patients were mapped to a large human molecular interaction network, consisting of 49,419 interactions (including protein-protein and protein-DNA interactions) among 9,795 genes/proteins, compiled from high-throughput screenings and curation of previous measurements reported in the literature. A search over this network was performed to identify prognostic subnetworks that could be used to predict treatment-free survival. Specifically, each subnetwork was scored by a vector of activities across all patients, where the activity for a given patient is a function of the expression levels of its member genes. A subnetwork’s prognostic power was computed as the uni-variate Cox score between the activity vector and the patient’s treatment-free survival. The resulting ~200 prognostic subnetworks identify new putative cancer markers and provide an array of “small-scale” models charting the molecular mechanisms correlated with CLL progression, e.g. subnetworks detailing interactions between proteins participating in Wnt signaling, Notch signaling, or cell death. Moreover, our network-based classification achieves higher accuracy in predicting duration of treatment-free survival in newly diagnosed patients than identified uniparameter prognostic markers or standard gene-expression array analyses. Thus, our network-based approach integrating protein interactions with CLL expression profiles leads to increased classification accuracy and, simultaneously, provides a view of the biological processes underlying cancer progression.
Expression-based prognosis of CLL progression. Example of treatment-freesurvival analysis is shown in one pair of training and test set. p-values are derived from log-rank tests on the survival curves.
Expression-based prognosis of CLL progression. Example of treatment-freesurvival analysis is shown in one pair of training and test set. p-values are derived from log-rank tests on the survival curves.
Disclosures: No relevant conflicts of interest to declare.
Author notes
Corresponding author


This feature is available to Subscribers Only
Sign In or Create an Account Close Modal