Abstract
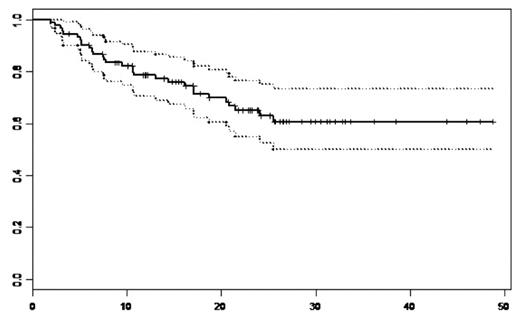
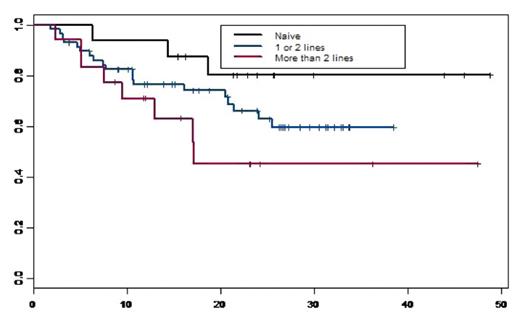
We conducted a retrospective single institution analysis to evaluate the immediate and long-term efficacy, tolerance, survival and time to progression of MM patients (pts) who received VELCADE (Vel.) as induction and in those who relapsed or were refractory after standard therapies. A total of 92 pts were included, 62 (67%) males and 30 (33%) females. Median age at treatment was 60 years [35–79]. At diagnosis, there were 48 (52%) IgG, 24 (26%) IgA, 2 (2%) IgD, 15 (16%) light chains and 3 (4%) plasma cell leukaemias, 11pts (12%) were in stage I A, 12 (13%) stage IIA and 69 (75%) stage III (51 A and 18B). The median level of β2 microglobulin was 3.28 mg/l (1.12–24). Among 42 evaluated del(13), 19 (45%) were + in which there was two t(4;14)+. We defined 3 groups: group1:16 (17%) pts who received Vel. as induction, group2:58 (63%) pts who received Vel. as 2nd line n=41 or 3rd line n=17, group 3:18 (12%) pts who received Vel. as ≥ 4th line. Prior to Vel.(groups 2 and 3), 53 (70%) pts had received an autologous hematopoietic stem cell transplantation (HSCT), 13 (14%) allogeneic HSCT and 35 (46%) thalidomide (Thal.) (median dose of 200mg/day, median duration of 4 months). The median interval between diagnosis and Vel. initiation was 28.3 months (0.2–125); 28 pts had an interval less than 12 months (16 in 1st line), 27 pts between 12 and 36 months and 37 pts with more than 36 months. The median number of Vel. cycles in group 1, 2 and 3 were 4[2–9], 5[2–12] and 5[3–12] respectively with a standard dose of 1.3 mg/m2 decreased to 1.0 mg/m2 in case of toxicity (<3 cycles: n=18, 4–6: n=52; 7–8: n=14; >8: n=8). Fifty-two (57%) pts received an association of dexamethasone (40mg/day). There were 6 Vel. discontinuation (<3 Vel.cycles) and 25 (27%) dose reduction due to neuropathy [3cycles n=2 (17%), 4–6 cycles n=12 (23%), 7–8 cycles, n=7 (50%) and ≥9 n=4 (50%)]. Peripheral neuropathy occurred in 61 pts (66%) [32 (52%)gr1, 18 (30%)gr2, 9 (15%)gr3 and 4 (3%)gr4], in which, 25 (41%) had previously received Thal. [12 (48%)gr1, 8 (32%)gr2, 5 (20%)gr3]. The most other common toxicities were, fatigue n=35 (38%), constipation n=18(20%), diarrhea n= 11(12%), nausea n=14(15%) and vomiting n=7(8%). The overall response rate was observed in 67 (73%) pts [13 (14%)CR, 22 (24%)VGPR and 32 (35%)PR]. With a median follow-up of 23.4 months, the median overall survival (OS) for the whole population and for group 1 and 2 was not reached, and was 17 months for group 3. The probability of OS at 3 years for the whole population was 61%[50–73.5] (Figure 1) and were: 80%[62–100], 66%[54–81] and 45%[25–82.5] for groups 1, 2 and 3 respectively (Figure 2). The probability of OS at 5 years for the whole population from MM diagnosis was 72.5%[63–84]. The median time to progression (TTP) was 25.5 months for the whole population; it was not reached for group 1, were 25.5 and 13 months for group 2 and 3 respectively. The probability of progression-free survival (PFS) at 2 years was 51%[40–64,5] for the whole population and 66%[45–96], 52%[39–70] and 29%[12–71] for group 1, 2 and 3 respectively. We showed no significant difference in term of OS (p=0,166) and PFS (p=0.495) between the patients with del(13) [51% (31–83) and 42(23–78)] and without del(13) [83%(68,5–99,6) and 58%(40–85,5)]. Finally we observed a better PFS at 2 years for pts receiving lenalidomide after Vel. versus those who did not, 64%[42–96] and 48%[36–63] respectively. The multivariate analysis (studying: age, sex, stage, beta2M, del(13), previous lines, allogeneic HSCT, Thal., and interval diag-Vel.) showed only a significant impact of thalidomide HR=3.06 (1.37–6.85) (p=0,006), and a trend for interval diag-Vel. In conclusion, this analysis showed a very good percentage of long-term OS with a median not reached for Vel. naïve or 2nd, 3rd Vel line MM pts. Moreover, we showed a significant negative impact of previous Thal. treatment and no impact of del(13).
Disclosures: No relevant conflicts of interest to declare.
Author notes
Corresponding author


This feature is available to Subscribers Only
Sign In or Create an Account Close Modal