

Abstract
We performed a retrospective analysis from our transplant registry on first allogeneic hematopoietic stem cell transplantations (HSCT) for acute myeloid leukemia (AML) patients (pts) between 1996 and 2007. Our principal objective was to analyze the impact of molecular markers on the long-term overall and disease-free survival (OS and DFS) after first allogeneic HSCT. We found 364 pts, only 63 pts had retrospectively available conserved cells at diagnosis. The expression levels of WT1, Evi1, Flt3 and Hoxa9 were performed by quantitative RT-RQPCR. The mutational status of MLL duplication, FLT3 (internal tandem duplication or nucleotide substitutions) (ITD), NPM1 and CEBPα were determined by PCR, RFLP and/or sequencing analysis. All pts except 1 had a karyotype analysis at diagnosis. Among these 63 pts, there were 27 (43%) males and 36 (57%) females, with a median age of 41 years (18-64). The FAB classification was M0: 6, M1: 10, M2: 13, M4: 6, M5: 21, M6: 3, M7: 1 and 3 unclassified. Concerning the karyotype analysis, 25 (40%) pts had a normal karyotype, 37 (60%) pts presented cytogenetic abnormalities classified as favourable prognosis in 5 cases (8%), intermediate in 13 cases (21%) and poor in 19 cases (31%). Regarding the molecular markers evaluated in all pts: 4(6%) pts had Flt3over-expressed (ov-ex), 19 (30%) FLT3 ITD+, 3 (5%) MLLdup, 10 (16%) Hoxa9 ov-ex, 7 (11%) Evi1 ov-ex, 15 (24%) NPM1mut+, 25 (40%) WT1 ov-ex and 1 CEBPαmut+ (this marker was evaluated only in 12 pts). Associations between these markers and the karyotype prognosis groups are shown in Figure1. Twenty three (36%) pts had no abnormal molecular markers and 40 (54%) pts had at least one abnormal marker: 10 (16%) 1 marker, 10 (16%) 2 markers, 12 (19%) 3 markers, 4 (6%) 4 markers and 4 (6%) 5 markers. Concerning the karyotype, among the 23 negative molecular pts, 22 have been evaluated and there were 9 (41%) normal, 11 (50%) poor and 2 (9%) favourable; and among the 40 positive pts, 16 (40%) were normal, 8 (20%) poor, 13 (32.5%) intermediate and 3 (7.5%) favourable. Concerning transplantation, 50% of HSCT were done after 2004 and the median interval between diagnosis and transplantation was 6 months (2.6–68.5). Before conditioning, 41 pts were in CR (26 CR1, 14 CR2 and 1 CR3), 8 in PR and 14 in relapse. Twenty five (40%) pts received a non-myelo-ablative conditioning and 38 (60%) a myelo-ablative one. There were 34 sex-mismatched (21 M→F and 13 F→M), 21 ABO incompatibility (6 minor and 15 major), 55 were HLA matched and 8 mismatched. Twenty three (36.5%) pts received PBSC, 37 (59%) bone marrow and 4 (6.5%) cord blood cells from 47 (75%) HLA siblings and 16 (25%) unrelated donors. After transplantation, 59 (94%) pts engrafted, 42 developed AGVHD (21gr1, 13 gr2 and 8 gr4), and among 51 evaluable pts, 13 developed cGVHD (7 limited and 6 extensive). At the last follow-up, 20 pts have relapsed, 29 pts are alive (28 CR and 1PR) and 34 died [18 (53%) from TRM and 16 (47%) from relapse]. At the median follow-up of 48 months, the OS and DFS for the whole population were 40% (33–47) and 40% (34–46) respectively with a maximum follow-up of 130 months and for the different subgroups according to karyotype and molecular markers the results are shown in Table 1. The univariate analysis showed a significant impact of FLT3 ITD and over-expression of FLT3RQ on long-term DFS, (p=0.03 and p=0.02 respectively), and a trend on long-term OS (p=0.08). Concerning the karyotype and some other markers (MLL, EVI1, NPM1 and Hoxa9), we did not observe any significant difference because of small number of pts in some subgroups. The known benefic impact of NPM1mut+, was erased because the majority of this group presented an associated FLT3 ITD+. In addition, we are performing a multivariate analysis that will be presented. In conclusion, allogeneic HSCT in this high risk population of AML pts, allowed a good probability of long-term OS and DFS, despite the presence of high number of bad molecular markers and cytogenetic abnormalities. Finally, AML pts with FLT3 ITD+ seem not benefit from allogeneic HSCT as well as patients with NPM1mut+ associated with FLT3ITD+.

Frequencies and distribution of different molecular markers and karyotype subgroups
Frequencies and distribution of different molecular markers and karyotype subgroups
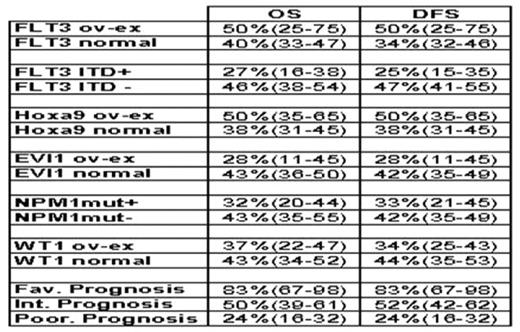
Table 1. OS and DFS according to different molecular markers and karyotype subgroups
Disclosures: No relevant conflicts of interest to declare.

This feature is available to Subscribers Only
Sign In or Create an Account Close Modal