Abstract
Background: Chronic myelomonocytice leukemia is characterized by peripheral blood/bone marrow monocytosis and variable degree of dysplasia. The World Health Organization classification includes it in a myelodysplastic/myeloproliferative disorder category. We have reported earlier on a predictive model (MDAPS) based on hemoglobin, presence of circulating immature cells, absolute lymphocyte count and blast percentage and this has been validated in prospective group (
Patients and Method: We performed an analysis of 279 patients seen at MD Anderson Cancer Center between the years 1999–2007. We also included 26 (9%) patients who underwent SCT in the analysis. Patients were assigned a score according to the International Prognostic Scoring System (IPSS) used for patients with myelodysplastic syndrome. Cox proportional hazard regression models were used for each variable. Log transformations were used for WBC, platelet counts, lactate dehydrogenase levels and absolute monocyte counts. Stepwise model selection was employed to fit a multivariable model.
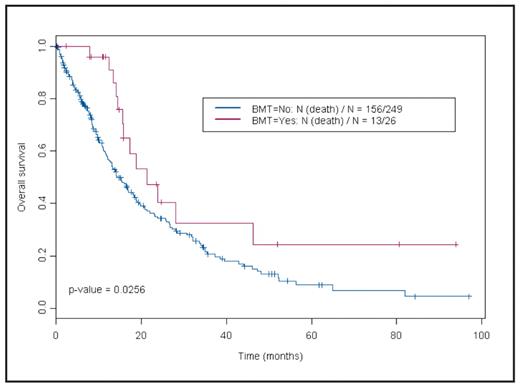
Results: Median age of patients is 68 years (range, 30–89), WBC count 14.5 x10⁶/ml (range, 1.7–99), hemoglobin 10.3 gm/dL (range, 5.9–16.4), platelet count 98 x106/ml, beta 2 micrglobulin 4.1 mg/L (range, 1.2–20), absolute monocyte count 2.9 x10⁶/ml (range, 1–40.2). Median survival is 15.7 months [95% confidence interval (CI); 13.9–18.8]. In univariate analysis patients undergoing stem cell transplantation survived longer than the others (hazards ratio 0.59, 95% CI 0.3–0.9) (Fig.1). Survivals at 2 and 5 years were 40.5% (95% CI, 0.22–0.72) and 24.3 (95% CI, 0.1–0.6) respectively in patients undergoing transplant versus 34.3% (95% CI, 0.27–0.42) and 8.9% (95% CI, 0.05–0.17) for others. Additionally WBC, creatinine, LDH, absolute monocyte count, hemoglobin and platelet count were laboratory parameters significantly associated with survival (Table 1). Splenomegaly, higher IPSS score (1.5 and above) and poor-risk cytogenetics (−5 and or −7, 8 abnormality) predicted for worse survival. Multivariate analysis indicated that lower hemoglobin level and platelet count and higher absolute monocyte count predicted for worse survival. Further analysis including treatment as a variable is in progress.
Conclusion: Survival of patients with CMML has not improved despite availability of agents with activity in this disease. SCT may improve outcome but larger number of patients is needed for definitive answer.
Table 1. Univariate analysis
| Variable . | HR(95%CI) . | p-value . |
|---|---|---|
| Age | 1.01 (1.00–1.03) | 0.10 |
| WBC | 1.44 (1.22–1.70) | <.0001 |
| Hemoglobin | 0.84 (0.78–0.91) | <.0001 |
| Platelet | 0.80 (0.70–0.92) | 0.001 |
| Creatinine | 1.17 (1.06–1.28) | 0.001 |
| LDH | 1.35 (1.04–1.77) | 0.03 |
| Absolute Monocyte count | 1.47 (1.24–1.74) | <.0001 |
| Bone marrow blast percentage | 1.04 (1.01–1.07) | 0.01 |
| Normal spleen size | 0.69 (0.49–0.96) | 0.03 |
| IPSS (1.5 or higher) | 2.23 (1.35–3.67) | 0.002 |
| SCT | 0.53 (0.30–0.93) | 0.03 |
| Cytogenetics (−5, −5 and −7, −7,+8) | 2.09 (1.43–3.05) | 0.0001 |
Survival analysis according to stem cell transplant status
Survival analysis according to stem cell transplant status
Disclosures: No relevant conflicts of interest to declare.
Author notes
Corresponding author


This feature is available to Subscribers Only
Sign In or Create an Account Close Modal