Abstract
Introduction: Epigenetic changes have been implicated in the pathogenesis of several human hematologic malignancies, including non-Hodgkin’s lymphomas (NHL). Vorinostat, a novel pan-histone deacetylase inhibitor (HDACi), has shown significant clinical activity in cutaneous T-cell lymphoma. This class of agents enhances transcription of target genes through histone hyperacetylation and through interactions with signal transduction mediators and transcription factors. Bortezomib is a reversible inhibitor of the chymotrypsin-like activity of the human 20s proteasome with established clinical activity in mantle cell lymphoma. The combination of vorinostat and bortezomib has exhibited synergism in several hematologic malignancy models. We sought to further explore the effects of these two agents in T-cell NHL cell lines and explore levels of apoptosis in response to combination treatment with vorinostat and bortezomib.
Methods: A panel of T-cell NHL cell lines (SR, SUDHL1, SUPM2, SUPT1, L82, and HH), representing several different subtypes, were evaluated to assess the activity of vorinostat and bortezomib. Cells were plated at a concentration of 2 × 10⁵ cells/mL and cultures were treated with varying concentrations of each agent (0.5 μM to 10 μM) and assessed after 24 hours for levels of apoptosis. Apoptosis and viability were analyzed through propidium iodide flow cytometry. Levels of apoptosis were considered significant at 30% cells in sub G0 phase. Further studies were undertaken to assess possible mechanisms of action contributing to this apoptosis. TRAIL, DR4, and DR5 concentrations were measured in these lines through ELISA and cell surface flow cytometry.
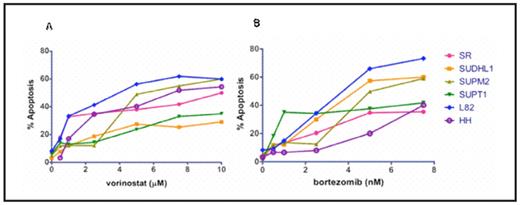
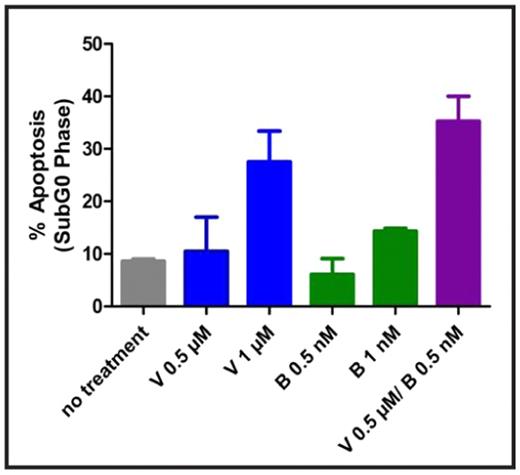
Results: Heterogeneity was observed throughout the various T-cell NHL lines in response to vorinostat and bortezomib as single agents. After treatment with 1 μM of vorinostat and 5 nM of bortezomib, L82 cells (ALK negative anaplastic large cell lymphoma) exhibited approximately 40% and 60% apoptosis respectively (see figure 1). These concentrations of both vorinostat and bortezomib are consistent with clinically relevant maximum tolerated dose equivalents for each agent. IC50s were obtained for all cell lines tested within therapeutic ranges. Combination therapy resulted in additive levels of apoptosis in all cell lines, with a subset resulting with synergistic apoptotic levels as indicated by combination index values < 1 using the median effect method of Chou and Talalay (see figure 2). Apoptosis in L82 cells treated by a combination of suboptimal doses of each agent (vorinostat 0.5 μM and bortezomib 0.5 nM) was substantially higher at 35%. Similar results were noted for the SUPT1 and HH cell lines at levels of vorinostat 1 μM/bortezomib 1 nM and vorinostat 0.5 μM and bortezomib 1 nM respectively.
In cells treated with vorinostat and bortezomib as single agents and in combination, upregulation in the components of the TRAIL dependent apoptotic system was noted. Transcriptional increases of DR5 and TRAIL mRNA was demonstrated in a dose dependent manner after single agent treatment of vorinostat and bortezomib in L82, SUDHL1, and HH cell lines. Further, flow cytometry and ELISA measurements demonstrated an increase in protein levels of DR5 and TRAIL in a dose dependent manner with both vorinostat and bortezomib.
Conclusions: There is evidence that T-cell NHL cells are sensitive to both vorinostat and bortezomib as single agents and that there is synergy with combination therapy. TRAIL/DR5 expression may be altered by treatment with these agents and cause cell death through the extrinsic apoptotic pathway. These findings warrant further exploration of this combination in the clinical setting.
Vorinostat and bortezomib activity in T-cell NHL
T-cell NHL cell lines after treatment with vorinostat (A) and bortezomib (B) as single agents at varying concentrations.
Vorinostat and bortezomib activity in T-cell NHL
T-cell NHL cell lines after treatment with vorinostat (A) and bortezomib (B) as single agents at varying concentrations.
Synergism of vorinostat and bortezomib in T-cell NHL
L82 cells after treatment with vorinostat and bortezomib in combination.
Synergism of vorinostat and bortezomib in T-cell NHL
L82 cells after treatment with vorinostat and bortezomib in combination.
Disclosures: No relevant conflicts of interest to declare.
Author notes
Corresponding author


This feature is available to Subscribers Only
Sign In or Create an Account Close Modal