

Abstract
To quantify how various molecular mechanisms are integrated to maintain platelet homeostasis and allow responsiveness to adenosine diphosphate (ADP), we developed a computational model of the human platelet. Existing kinetic information for 77 reactions, 132 fixed kinetic rate constants, and 70 species was combined with electrochemical calculations, measurements of platelet ultrastructure, novel experimental results, and published single-cell data. The model accurately predicted: (1) steady-state resting concentrations for intracellular calcium, inositol 1,4,5-trisphosphate, diacylglycerol, phosphatidic acid, phosphatidylinositol, phosphatidylinositol phosphate, and phosphatidylinositol 4,5-bisphosphate; (2) transient increases in intracellular calcium, inositol 1,4,5-trisphosphate, and Gq-GTP in response to ADP; and (3) the volume of the platelet dense tubular system. A more stringent test of the model involved stochastic simulation of individual platelets, which display an asynchronous calcium spiking behavior in response to ADP. Simulations accurately reproduced the broad frequency distribution of measured spiking events and demonstrated that asynchronous spiking was a consequence of stochastic fluctuations resulting from the small volume of the platelet. The model also provided insights into possible mechanisms of negative-feedback signaling, the relative potency of platelet agonists, and cell-to-cell variation across platelet populations. This integrative approach to platelet biology offers a novel and complementary strategy to traditional reductionist methods.
Introduction
Platelets respond to endothelial injury or activating agonists by engaging a host of intracellular signaling events, including receptor activation, G protein signaling, second messenger generation, Ca2+ release, granule secretion, and cytoskeletal rearrangement.1,2 Although the molecular details underlying individual activation events are continuously refined through focused studies, it has been difficult to develop a unified and integrated view of platelet metabolism because it involves a large number of simultaneously interacting molecular components. To this end, computational models help provide an integrated view of the many interacting components involved in cellular signaling.3 Successful applications of the “systems biology” approach have led to an improved understanding of cell surface receptors,4,5 quantitative prediction of protease cascades in blood coagulation,6-8 and the discovery of novel molecular interactions.9 When based on reliable datasets, accurate models have the potential to not only explain previously observed behaviors but also to make experimentally verifiable predictions about how cells process biologic signals.10
In many ways, the platelet provides an ideal test system for human systems biology. Platelets from normal donors or patients are readily available for in vitro diagnostic research and clinical monitoring. Isolated platelets, platelet-rich plasma (PRP), or whole blood are amenable to high throughput experiments to study signal transduction and associated coagulation protease cascades. In addition, numerous genetic mutations in humans11 as well as knockout and transgenic mice12,13 are known that predispose to bleeding phenotypes. From a modeling perspective, the platelet is particularly well suited for study because it lacks a nucleus, allowing one to avoid the challenges of describing whole-genome transcriptional regulation. Finally, the well-appreciated importance of platelets in mediating thrombosis and hemostasis, as well as their contribution to systemic disorders such as inflammation and cancer,14 places a high practical value on an accurate platelet model. Such a model would be useful both as a basic research tool for predicting normal activation behavior and as a strategy for the rational design of patient-specific pharmaceutical therapies.15
In this study, we describe a computational model of the human platelet that accurately predicts both resting and activated system behaviors. The model is based on 24 peer-reviewed studies spanning 3 decades of platelet research. Because of the inherent complexity in a model of this size, we first constructed a set of 4 distinct signaling “modules” to describe: (1) Ca2+ release and uptake, (2) phosphoinositide (PI) metabolism, (3) P2Y1 G-protein signaling, and (4) protein kinase C (PKC) regulation of phospholipase C-β (PLC-β). Using fixed reaction equations and fixed kinetic parameters, each module was tuned to match a relevant set of experimental data by selecting allowable values for the resting concentrations of the module species. For the final analysis, the 4 modules were merged into a single kinetic model and fit to Ca2+ release data from adenosine diphosphate (ADP)–stimulated platelets. Dynamic traces of intracellular Ca2+ represent multiple steps in a complex signaling pathway from extracellular ligand to intracellular activation response, incorporating dynamic contributions from each module in the system. The fully integrated model was capable of reproducing population and single-cell Ca2+ release data as well as measurements of PI turnover and G protein activation.
Methods
ADP-stimulated Ca2+ release assay
Human blood was collected from healthy donors via venipuncture and anticoagulated with sodium citrate (9 parts blood to 1 part sodium citrate). PRP was incubated for 45 minutes with Fluo-4 NW (Invitrogen, Carlsbad, CA) per the manufacturer's instructions. PRP was diluted to a final concentration of 12% on a 384-well plate. A separate plate containing various concentrations of ADP was prepared on a PerkinElmer Janus (PerkinElmer Life and Analytical Sciences, Boston, MA). Intracellular Ca2+ concentration was quantified by measuring F(t)/F0 using a Molecular Devices FlexStation (Sunnyvale, CA). Results are the average time-series measurements of 6 replicates. Phlebotomy was conducted in accordance with the Declaration of Helsinki and under University of Pennsylvania Institutional Review Board approval.
Platelet image analysis
High-resolution electron micrographs of platelets stained with glucose-6-phosphatase obtained from Ebbeling et al16 were used to quantify the relative area of the dense tubular system (DTS) with respect to cytoplasmic area. Stained areas were delineated by using a threshold value for pixel intensity. To determine the sensitivity of the technique to the chosen threshold value, we calculated the DTS area using a maximally inclusive threshold (all stained regions and some of periphery included in delineation) and a minimally inclusive threshold value (delineation entirely within stained portion of image). The range of results obtained by both threshold values did not differ by more than a factor of 2.
Model construction and simulation
Ordinary differential equations (ODEs) were used to describe reaction rates corresponding to published reaction mechanisms and kinetic parameters (Table 1). To efficiently estimate the dynamic range of initial conditions (ICs), the abundance of each estimated species or compartment size was estimated over a base-10 logarithmic scale. For reactions occurring at compartmental interfaces (eg, cytosol and plasma membrane), reaction rates were adjusted by scaling the concentrations of reactants to the bulk compartment as described by Kholodenko et al.5 Within each of the 5 compartments, species were assumed to be well mixed. Although we do not discount the importance of spatial gradients in Ca2+ signaling,17 previous studies have shown that changes in [Ca2+]i within platelets are effectively instantaneous.18 Simulations were performed using the SBToolbox for MATLAB (Mathworks, Natick, MA).19 Numerical integration was performed with an absolute tolerance of 10−45 and a relative tolerance of 10−9.
Reaction equations, rate laws, and kinetic parameters comprising the platelet model
| Reaction/quantity | Mechanism | Rate law/rule | Parameter values | Reference* |
|---|---|---|---|---|
| SERCA shuttling | SERCAE2 ⇆ SERCAE1 | k1 · [SERCAE2] − k−1 · [SERCAE1] | k1 = 600 s−1, k−1 = 600 s−1 | 1 |
| Ca2+cyt binding SERCA | SERCAE1 + 2 Ca2+cyt ⇆ SERCAE1·Ca2+2 | k1 · [SERCAE1] · [Ca2+cyt] · [Ca2+cyt] − k−1 · [SERCAE1·Ca2+2] | k1 = 1 × 10¹⁵ M−2·s−1, k−1 = 10 s−1 | 1 |
| Phosphorylation of SERCA | SERCAE1·Ca2+ ⇆ SERCAE1P·Ca2+ | k1 · [SERCAE1Ca2+] − k-1 · [SERCAE1P·Ca2+] | k1 = 700 s−1, k−1 = 5 s−1 | 1 |
| Ca2+ transport across IM | SERCAE1P·Ca2+ ⇆ SERCAE2P·Ca2+ | k1 · [SERCAE1P·Ca2+] − k-1 · [SERCAE2P·Ca2+] | k1 = 600 s−1, k−1 = 50 s−1 | 1 |
| Ca2+dts release into DTS | SERCAE2P·Ca2+2 ⇆ SERCAE2P + 2 Ca2+dts | k1 · [SERCAE2P·Ca2+2] − k-1 · [SERCAE2P] · [Ca2+dts] · [Ca2+dts] | k1 = 1000 s−1, k−1 = 4 × 10⁹ M−2·s−1 | 1 |
| SERCA dephosphorylation | SERCAE2P ⇆ SERCAE2 | k1 · [SERCAE2P] − k-1 · [SERCAE2] | k1 = 500 s−1, k−1 = 1 s−1 | 1 |
| IP3R inhibition | IP3Rn + Ca2+cyt ⇆ IP3Ri1 | [IP3Rn] · ((k1 · L1 + l2) · [Ca2+cyt] / (L1 + [Ca2+cyt] · (1 + L1 / L3))) − [IP3Ri1] · (k−1 + l−2) | k1 = 0.64 s−1·μM−1, L1 = 0.12 μM, l2 = 1.7 s−1, L3 = 0.025 μM, k−1 = 0.04 s−1, l−2 = 0.8 s−1 | 2 |
| IP3R binding IP3 | IP3Rn + IP3 ⇆ IP3Ro | [IP3Rn] · [IP3] · ((k2 · L3 + l4 · [Ca2+cyt]) / (L3 + [Ca2+cyt] · (1 + L3 / L1))) − [IP3Ro] · ((k−2 + l-4 · [Ca2+cyt]) / (1 + [Ca2+cyt] / L5)) | k2 = 37.4 s−1·μM−1, l4 = 1.7 s−1·μM−1, k−2 = 1.4 s−1, l-4 = 2.5 μM−1·s−1, L5 = 54.7 μM | 2 |
| IP3R activation | IP3Ro + Ca2+cyt ⇆ IP3Ra | [IP3Ro] · ((k4 · L5 + l6) · [Ca2+cyt] / (L5 + [Ca2+cyt])) − [IP3Ra] · (L1 · (k-4 + l-6) / (L1 + [Ca2+cyt])) | k4 = 4 s−1·μM−1, L5 = 54.7 μM, l6 = 4707 s−1, L1 = 0.12 μM, k-4 = 0.54 s−1·μM−1, l-6 = 11.4 s−1 | 2 |
| IP3R inhibition | IP3Ra + Ca2+cyt ⇆ IP3Ri2 | [IP3Ra] · (k1 · L1 + l2) · [Ca2+cyt] / (L1 + [Ca2+cyt]) − [IP3Ri2] · (k−1 + l−2) | k1 = 0.64 s−1·μM−1, L1 = 0.12 μM, l2 = 1.7 s−1, k−1 = 0.04 s−1, l−2 = 0.8 s−1 | 2 |
| IP3R closing | IP3Ro ⇆ IP3Rs | [IP3Ro] · (k3 · L5 / (L5 + [Ca2+cyt])) − [IP3Rs] · k-3 | k3 = 11 s−1·μM−1, L5 = 54.7 μM, k-3 = 29.8 s−1 | 2 |
| Channel open probability (Po) | (0.9 · IP3Ra / IP3Rtotal + 0.1 · pIP3Ro / IP3Rtotal)4 | 2 | ||
| IM potential (ψIM) | RT / zF · ln (Ca2+dts / Ca2+cyt) | † | ||
| PM potential (ψPM) | RT / zF · ln (Ca2+prp / Ca2+cyt) | † | ||
| Ca2+ release from DTS | Ca2+dts ⇆ Ca2+cyt | NIP3R · Po · γIP3R · e · ψIM | γIP3R = 10 pS | 3† |
| Ca2+ leak across PM | Ca2+prp ⇆ Ca2+cyt | SAPM · γleak · ψPM | γleak = 0.7 pS·m−2 | |
| PLC-β* binding PI | PLC-β* + PI ⇆ PLC-β*·PI | k1 · [PLC-β*] · [PI] − k−1 · [PLC-β*·PI] | k1 = 1 × 10⁸ s−1·M−1, k−1 = 70499 s−1 | 4 |
| PLC-β* hydrolyzing PI | PI → DAG + I1P | kcat · [PLC-β*·PI] | kcat = 1.43 s−1 | 4 |
| PLC-β* binding PIP | PLC-β* + PIP ⇆ PLC-β*·PIP | k1 · [PLC-β*] · [PIP] − k−1 · [PLC-β*·PIP] | k1 = 1 × 10⁸ s−1·M−1, k−1 = 19000 s−1 | 4 |
| PLC-β* hydrolyzing PIP | PIP → DAG + IP2 | kcat · [PLC-β*·PIP] | kcat = 0.35 s−1 | 4 |
| PLC-β* binding PIP2 | PLC-β* + PIP2 ⇆ PLC-β*·PIP2 | k1 · [PLC-β*] · [PIP2] − k−1 · [PLC-β*·PIP2] | k1 = 1 × 10⁸ s−1·M−1, k−1 = 49990 s−1 | 4 |
| PLC-β* hydrolyzing PIP2 | PIP2 → DAG + IP3 | kcat · [PLC-β*·PIP2] | kcat = 9.8505 s−1 | 4 |
| Phosphorylation of PI | PI → PIP | kcat · [PIK] · [PI] / (KM + [PI]) | KM = 0.016 mM−1, kcat = 2.77 s−1 | 5 |
| Phosphorylation of PIP | PIP → PIP2 | kcat · [PIPK] · [PIP] / (KM + [PIP]) | KM = 0.01 mM−1, kcat = 1.021 s−1 | 6 |
| Dephosphorylation of PIP2 | PIP2 → PIP | kcat · [PIP2P] · [PIP2] / (KM + [PIP2]) | KM = 250 μM−1, kcat = 1 s−1 | 7 |
| Dephosphorylation of I1P | I1P → I | kcat · [IPP] · [I1P] / (KM + [I1P]) | KM = 0.12 mM−1, kcat = 1 s−1 | 8 |
| Dephosphorylation of I4P | I4P → I | kcat · [IPP] · [I4P] / (KM + [I4P]) | KM = 0.12 mM−1, kcat = 1 s−1 | 8 |
| Dephosphorylation of IP2 | IP2 → I4P | kcat · [IP2P] · [IP2] / (KM + [IP2]) | KM = 0.9 μM−1, kcat = 0.05 s−1 | 9 |
| Dephosphorylation of IP3 | IP3 → IP2 | kcat · [IP3P] · [IP3] / (KM + [IP3]) | KM = 24 μM−1, kcat = 31 s−1 | 10 |
| Phosphorylation of DAG | DAG → PA | kcat · [DGK] · [DAG] / (KM + [DAG]) | KM = 0.25 mM−1, kcat = 0.26 s−1 | 11 |
| Synthesis of CDPDG | CTP + PA → CDPDG | kcat · [CDS] · [PA] · [CTP] / (KM1 · KM2 + (KM1 · [PA] + KM2 · [CTP] + [PA] · [CTP])) | KM1 = 0.5 mM−1, KM2 = 1.0 mM−1, kcat = 8.9 s−1 | 12 |
| Synthesis of PI | CDPDG + I → PI | kcat · [PIS] · [CDPDG] · [I] / (KM1 · KM2 + (KM1 · [I] + KM2 · [CDPDG] + [I] · [CDPDG])) | KM1 = 13 μM−1, KM2 = 0.28 mM−1, kcat = 13.6 s−1 | 13 |
| Activation of PKC | PKC ⇆ PKCa | k1 · [PKC] − k−1 · [PKCa] | k1 = 1 s−1, k−1 = 2 s−1 | 14 |
| Activation of PKC·Ca2+cyt | PKC·Ca2+cyt ⇆ PKCa·Ca2+cyt | k1 · [PKC·Ca2+cyt] − k−1 · [PKCa·Ca2+cyt] | k1 = 1.3 s−1, k−1 = 3.5 s−1 | 14 |
| Activation of PKC·Ca2+cyt ·DG | PKC·Ca2+cyt ·DAG ⇆ PKCa·Ca2+cyt ·DAG | k1 · [PKC·Ca2+cyt ·DAG] − k−1 · [PKCa·Ca2+cyt ·DAG] | k1 = 1 s−1, k−1 = 0.1 s−1 | 14 |
| PKC binding Ca2+cyt | PKC + Ca2+cyt ⇆ PKC·Ca2+cyt | kon · [PKC] · [Ca2+cyt] − koff · [PKC·Ca2+cyt] | kon = 0.6 × 10⁶ M−1·s−1, koff = 0.5 s−1 | 14 |
| PKC·Ca2+cyt binding DAG | PKC·Ca2+cyt + DAG ⇆ PKC·Ca2+cyt ·DAG | kon · [PKC·Ca2+cyt] · [DAG] − koff · [PKC·Ca2+cyt ·DAG] | kon = 8 × 10³ M−1·s−1, koff = 8.6348 s−1 | 14 |
| PKCa binding Ca2+cyt | PKCa + Ca2+cyt ⇆ PKCa·Ca2+cyt | kon · [PKCa] · [Ca2+cyt] − koff · [PKCa·Ca2+cyt] | kon = 0.6 × 10⁶ M−1·s−1, koff = 0.5 s−1 | 14 |
| PKCa·Ca2+cyt binding DAG | PKCa·Ca2+cyt + DAG ⇆ PKCa·Ca2+cyt ·DAG | kon · [PKCa·Ca2+cyt] · [DAG] − koff · [PKCa·Ca2+cyt ·DAG] | kon = 8 × 10³ M−1·s−1, koff = 8.6348 s−1 | 14 |
| Activation of P2Y1 | P2Y1 ⇆ P2Y1* | k1 · [P2Y1] − (k1 / Kact) · [P2Y1*] | k1 = 7.9 s−1, Kact = 0.0001 | 15, 16† |
| Activation of P2Y1·ADP | P2Y1·ADP ⇆ P2Y1*·ADP | αk1 · [P2Y1·ADP] − (k1 / Kact) · [P2Y1*·ADP] | α = 3.35, k1 = 7.9 s−1, Kact = 0.0001 | 15, 16† |
| Activation of P2Y1·Gq·GDP | P2Y1·Gq·GDP ⇆ P2Y1*·Gq·GDP | βk1 · [P2Y1·Gq·GDP] − (k1 / Kact) · [P2Y1*·Gq·GDP] | β = 6.62, k1 = 7.9 s−1, Kact = 0.0001 | 15, 16† |
| Activation of P2Y1·ADP·Gq·GDP | P2Y1·ADP·Gq·GDP ⇆ P2Y1*·ADP·Gq·GDP | αβδk1 · [P2Y1·ADP·Gq·GDP] − (k1 / Kact) · [P2Y1*·ADP·Gq·GDP] | α = 3.35, β = 6.62, δ = 9.85, k1 = 7.9 s−1, Kact = 0.0001 | 15, 16† |
| P2Y1* binding Gq·GDP | P2Y1* + Gq·GDP ⇆ P2Y1*·Gq·GDP | βk11 · [P2Y1*] · [Gq·GDP] − (k11 / Kg) · [P2Y1*·Gq·GDP] | β = 6.62, k11 = 0.59 μM−1·s−1, Kq = 0.032 μM−1 | 15, 16† |
| P2Y1*·ADP binding Gq·GDP | P2Y1*·ADP + Gq·GDP ⇆ P2Y1*·ADP·Gq·GDP | βk11 · [P2Y1*·ADP] · [Gq·GDP] − (k11 / (δγKg)) · [P2Y1*·Gq·GDP] | β = 6.62, k11 = 0.59 μM−1·s−1, δ = 9.85, γ = 9.39, Kq = 0.032 μM−1 | 15, 16† |
| P2Y1 binding ADP | P2Y1 + ADP ⇆ P2Y1·ADP | k3 · [P2Y1] · [ADP] − (Kdk3) · [P2Y1·ADP] | k3 = 9.6 × 10⁷ M−1·s−1, Kd = 99 nM | 15, 16† |
| P2Y1·Gq·GDP binding ADP | P2Y1·Gq·GDP + ADP ⇆ P2Y1·ADP·Gq·GDP | k3 · [P2Y1·Gq·GDP] · [ADP] - (Kdk3 / γ) · [P2Y1·ADP·Gq·GDP] | k3 = 9.6 × 10⁷ M−1·s−1, Kd = 99 nM, γ = 9.39 | 15, 16† |
| P2Y1* binding ADP | P2Y1* + ADP ⇆ P2Y1*·ADP | αk3 · [P2Y1*] · [ADP] − Kdk3 · [P2Y1*·ADP] | α = 3.35, k3 = 9.6 × 10⁷ M−1·s−1, Kd = 99 nM | 15, 16† |
| P2Y1*·Gq·GDP binding ADP | P2Y1*·Gq·GDP + ADP ⇆ P2Y1*·ADP·Gq·GDP | αk3 · [P2Y1*·Gq·GDP] · [ADP] − (Kdk3 / δγ) · [P2Y1*·ADP·Gq·GDP] | α = 3.35, k3 = 9.6 × 10⁷ M−1·s−1, Kd = 99 nM, δ = 9.85, γ = 9.39 | 15, 16† |
| P2Y1*·Gq·GDP releasing GDP | P2Y1*·Gq·GDP ⇆ P2Y1*·Gq | k1 · [P2Y1*·Gq·GDP] − k−1 · [P2Y1*·Gq] · [GDP] | k1 = 17.8 s−1, k−1 = 1 × 10⁶ M−1·s−1 | 15, 16† |
| P2Y1*·Gq binding GTP | P2Y1*·Gq ⇆ P2Y1*·Gq·GTP | k1 · [P2Y1*·Gq] · [GTP] − k−1 · [P2Y1*·Gq·GTP] | k1 = 1 × 10⁵ M−1·s−1, k−1 = 8 s−1 | 15, 16† |
| P2Y1*·ADP·Gq·GDP releasing GDP | P2Y1*·ADP·Gq·GDP ⇆ P2Y1*·ADP·Gq | k1 · [P2Y1*·ADP·Gq·GDP] − k−1 · [P2Y1*·ADP·Gq] · [GDP] | k1 = 17.8 s−1, k−1 = 1 × 10⁶ M−1·s−1 | 15, 16† |
| P2Y1*·ADP·Gq binding GTP | P2Y1*·ADP·Gq ⇆ P2Y1*·ADP·Gq·GTP | k1 · [P2Y1*·ADP·Gq] · [GTP] − k−1 · [P2Y1*·ADP·Gq·GTP] | k1 = 1 × 10⁵ M−1·s−1, k−1 = 8 s−1 | 15, 16† |
| P2Y1*·Gq·GTP releasing Gq·GTP | P2Y1*·Gq·GTP ⇆ P2Y1* + Gq·GTP | k1 · [P2Y1*·Gq·GTP] − k−1 · [P2Y1*] · [Gq·GTP] | k1 = 850 s−1, k−1 = 1 × 10⁷ M−1·s−1 | 15, 16† |
| P2Y1*·ADP·Gq·GTP releasing Gq·GTP | P2Y1*·ADP·Gq·GTP ⇆ P2Y1*·ADP + Gq·GTP | k1 · [P2Y1*·ADP·Gq·GTP] − k−1 · [P2Y1*·ADP] · [Gq·GTP] | k1 = 850 s−1, k−1 = 1 × 10⁷ M−1·s−1 | 15, 16† |
| Gq·GTP autohydrolysis | Gq·GTP ⇆ Gα·GDP + Gβγ | kGTP · [Gq·GTP] | kGTP = 0.013 s−1 | 17 |
| Activated Gq subunit association | Gα·GTP + Gβγ ⇆ Gq·GTP | k1 · [Gα·GTP] · [Gβγ] − k−1 · [Gq·GTP] | k1 = 0.10 μM−1·s−1, k−1 = 7.78 s−1 | 15 |
| Unactivated Gq subunit association | Gα·GDP + Gβγ ⇆ Gq·GDP | k1 · [Gα·GDP] · [Gβγ] − k−1 · [Gq·GDP] | k1 = 0.10 μM−1·s−1, k−1 = 7.78 s−1 | 15 |
| PLC-β binding Gq·GTP | PLC-β + Gq·GTP ⇆ PLC-β*·Gq·GTP | k1 · [PLC-β] · [Gq·GTP] − k−1 · [PLC-β*·Gq·GTP] | k1 = 1.61 μM−1·s−1, k−1 = 0.19 s−1 | 15, 16† |
| PLC-β* hydrolyzing Gq·GTP | PLC-β*·Gq·GTP → PLC-β·Gq·GDP | kcat · [PLC-β*·Gq·GTP] | kcat = 25 s−1 | 17 |
| PLC-β releasing Gq·GDP | PLC-β·Gq·GDP ⇆ PLC-β + Gq·GDP | k1 · [PLC·Gq·GDP] − k−1 · [PLC-β] · [Gq·GDP] | k1 = 1 × 10⁵ s−1, k−1 = 100 M−1·s−1 | 15, 16† |
Of the 132 kinetic parameters, all but 11 were obtained from human platelet data or data from platelet-specific enzyme isoforms. These 11 parameters correspond to references 6, 8, 9, 11, and 12.
Dode L, Vilsen B, Van Baelen K, Wuytack F, Clausen JD, Andersen JP. Dissection of the functional differences between sarco(endo)plasmic reticulum Ca2+-ATPase (SERCA) 1 and 3 isoforms by steady-state and transient kinetic analyses. J Biol Chem. 2002;277:45579-45591.
Sneyd J, Dufour JF. A dynamic model of the type-2 inositol trisphosphate receptor. Proc Natl Acad Sci U S A. 2002;99:2398-2403.
Zschauer A, van Breemen C, Buhler FR, Nelson MT. Calcium channels in thrombin-activated human platelet membrane. Nature. 1988;334:703-705.
Rittenhouse SE. Human platelets contain phospholipase C that hydrolyzes polyphosphoinositides. Proc Natl Acad Sci U S A. 1983;80:5417-5420.
Kanoh H, Banno Y, Hirata M, Nozawa Y. Partial purification and characterization of phosphatidylinositol kinases from human platelets .Biochim Biophys Acta. 1990;1046:120-126.
Urumow T, Wieland OH. Purification and partial characterization of phosphatidylinositol-4-phosphate kinase from rat liver plasma membranes: further evidence for a stimulatory G-protein. Biochim Biophys Acta. 1990;1052:152-158.
Matzaris M, Jackson SP, Laxminarayan KM, Speed CJ, Mitchell CA. Identification and characterization of the phosphatidylinositol-(4, 5)-bisphosphate 5-phosphatase in human platelets. J Biol Chem. 1994;269:3397-3402.
Atack JR, Rapoport SI, Varley CL. Characterization of inositol monophosphatase in human cerebrospinal fluid. Brain Res. 1993;613:305-308.
Moyer JD, Reizes O, Dean NM, Malinowski N. D-myo-inositol (1,4)-bisphosphate 1-phosphate: partial purification from rat liver and characterization. Biochem Biophys Res Commun. 1987;146:1018-1026.
Mitchell CA, Connolly TM, Majerus PW. Identification and isolation of a 75-kDa inositol polyphosphate-5-phosphatase from human platelets. J Biol Chem. 1989;264:8873-8877.
Wissing J, Heim S, Wagner KG. Diacylglycerol kinase from suspension cultured plant cells: purification and properties. Plant Physiol. 1989;90:1546-1551.
Kelley MJ, Carman GM. Purification and characterization of CDP-diacylglycerol synthase from Saccharomyces cerevisiae. J Biol Chem. 1987;262:14563-14570.
Vargas LA, Li XM, Rosenthal AF. Inhibition of platelet phosphatidylinositol synthetase by an analog of CDP-diacylglycerol. Biochim Biophys Acta. 1984;796:123-128.
Bhalla US, Iyengar R. Emergent properties of networks of biological signaling pathways. Science. 1999;283:381-387.
Kinzer-Ursem TL, Linderman JJ. Both ligand- and cell-specific parameters control ligand agonism in a kinetic model of g protein-coupled receptor signaling. PLoS Comput Biol. 2007;3:e6.
Waldo GL, Harden TK. Agonist binding and Gq-stimulating activities of the purified human P2Y1 receptor. Mol Pharmacol. 2004;65:426-436.
Mukhopadhyay S, Ross EM. Rapid GTP binding and hydrolysis by G(q) promoted by receptor and GTPase-activating proteins. Proc Natl Acad Sci U S A. 1999;96:9539-9544.
Rate equation or kinetic parameters estimated de novo in this study.
Module calibration and analysis
The model topology was defined by a set of reaction equations, rate laws, and kinetic constants (Table 1). The concentrations of all enzymes and metabolites in the resting platelet at homeostasis comprise the IC space of the model. The topology of the Ca2+ signaling network and almost all other kinetic parameters are known from the literature (Table 1) except for those describing P2Y1 activation, which were calibrated from measurements of P2Y1-reconstituted proteoliposomes (“Receptor activation”). A subset of IC space for each module was established by use of homeostasis constraints and experimental data from platelets. The homeostasis constraint requires that a resting platelet remains resting such that the IC is also a steady-state solution of a given set of ODEs. We performed a dense sampling of unknown ICs over fixed reaction topologies to identify combinations of IC values that were consistent with known steady-state concentrations.
Calculation of Ca2+ spiking frequency distribution
As described by Heemskerk et al,18 strong release events were identified by taking the derivative of the Ca2+ flux traces and setting a noise threshold above which peaks were considered to be significant (Figure S3, available on the Blood website; see the Supplemental Materials link at the top of the online article). Video-imaged platelets were found to be quite variable both in peak interval times (4-40 seconds) and peak amplitudes (20-300 nM). We also observed significant variability in the platelet model, with peak amplitudes ranging from 100 to 300 nM. We were unable to estimate a single dominant frequency. using Fourier transform analysis of the simulated Ca2+ traces because of the substantial noise and irregularity of spiking. Half-maximal agonist dose (1 μM) was used to generate a frequency distribution for desensitized platelets treated with antagonists prostaglandin I2, apyrase, and aspirin before 20 μM of ADP.
Results
Model overview
The full model (Figure 1; Table 1) comprises 4 interlinked kinetic modules (Figure 2A-D). The Ca2+ module (Figure 2A) spans 5 compartments and functions to maintain a low intracellular Ca2+ concentration ([Ca2+]i) by pumping ions across the PM into the extracellular space, or across the membrane of the DTS into platelet stores using a sarcoplasmic/endoplasmic reticulum Ca2+ ATPase (SERCA). Inositol trisphosphate receptor (IP3R) channels release Ca2+ from the DTS and are regulated by inositol 1,4,5-trisphosphate (IP3) and Ca2+i. In the PI module (Figure 2B), membrane-derived signaling intermediates, such as IP3, are continuously recycled between the plasma membrane (PM) and cytosol by a series of phosphorylation, dephosphorylation, synthesis, and hydrolysis reactions (Table 1). Among its hydrolysis products, PLC-β generates PM-bound diacylglycerol (DAG), which, along with Ca2+i, modulates the activity of PKC. PKC dampens G protein-coupled receptor (GPCR)–mediated signaling by phosphorylating PLC-β, reducing its hydrolytic activity. In a module for receptor activation (Figure 2D), free ADP in the extracellular compartment binds to the GPCR P2Y1, causing a subsequent rise in activated G protein (Gq-GTP). Gq-GTP has a basal rate of hydrolysis that is accelerated when it is bound to PLC-β. The transient complex PLC-β-Gq-GTP (PLC-β*) is the hydrolytically active form of the enzyme and regulates transmembrane signaling in the PI module.

Schematic of platelet model compartmentalization and reactions. The full model comprises 5 compartments, 70 species, 77 reactions, and 132 kinetic parameters (Table 1). Three-dimensional compartments: extracellular (EX), cytosolic, and DTS. Two-dimensional compartments: PM and DTS inner membrane (IM). IPP indicates inositol phosphate phosphatase; IP2P, inositol bisphosphate phosphatase; IP3P, inositol trisphosphate phosphatase; DAG, diacylglycerol; PA, phosphatidic acid; CDP, CDP-DAG.
Schematic of platelet model compartmentalization and reactions. The full model comprises 5 compartments, 70 species, 77 reactions, and 132 kinetic parameters (Table 1). Three-dimensional compartments: extracellular (EX), cytosolic, and DTS. Two-dimensional compartments: PM and DTS inner membrane (IM). IPP indicates inositol phosphate phosphatase; IP2P, inositol bisphosphate phosphatase; IP3P, inositol trisphosphate phosphatase; DAG, diacylglycerol; PA, phosphatidic acid; CDP, CDP-DAG.

Detailed reaction schemes for platelet signaling modules. (A) Ca2+ module: cytosolic and DTS compartments are separated by the DTS membrane, which contains the IP3R and SERCA. (B) PI module: PM-bound PIs are cleaved by PLC-β to form diffusible inositol phosphates and DAG, which are substrates for resynthesis of PIs. (C) PKC module: Ca2+i and DAG activate PKC, which migrates to the PM where it phosphorylates PLC-β. (D) P2Y1 module: extracellular ADP binds to and activates P2Y1. Active P2Y1 accelerates guanine nucleotide exchange on bound Gq. Gq-GTP binds and activates PLC-β, which increases the GTPase activity of Gq-GTP. (E) SERCA catalytic cycle24 : Subscripts: E1, facing cytosol; E2, facing DTS; P, phosphorylated. (F) IP3R dynamics25 : Subscripts: n, native; i1, inhibited; o, open; a, active; s, shut, i2, inhibited. (G) PKC activation: Active kinase is bound to Ca2+i and DAG and located at the PM. Subscripts: M, located at the PM; C, Ca2+-bound; D, DAG-bound. (H) P2Y1 activation module: Rate equations describing the interactions among ADP, P2Y1, and Gq were modeled according to the ternary complex model described by Kinzer-Ursem et al46 For clarity, DTS membrane and cytosolic compartments are not delineated. A indicates ADP; P, P2Y1; G, Gq. *Ca2+ both activates and inhibits IP3R.25
Detailed reaction schemes for platelet signaling modules. (A) Ca2+ module: cytosolic and DTS compartments are separated by the DTS membrane, which contains the IP3R and SERCA. (B) PI module: PM-bound PIs are cleaved by PLC-β to form diffusible inositol phosphates and DAG, which are substrates for resynthesis of PIs. (C) PKC module: Ca2+i and DAG activate PKC, which migrates to the PM where it phosphorylates PLC-β. (D) P2Y1 module: extracellular ADP binds to and activates P2Y1. Active P2Y1 accelerates guanine nucleotide exchange on bound Gq. Gq-GTP binds and activates PLC-β, which increases the GTPase activity of Gq-GTP. (E) SERCA catalytic cycle24 : Subscripts: E1, facing cytosol; E2, facing DTS; P, phosphorylated. (F) IP3R dynamics25 : Subscripts: n, native; i1, inhibited; o, open; a, active; s, shut, i2, inhibited. (G) PKC activation: Active kinase is bound to Ca2+i and DAG and located at the PM. Subscripts: M, located at the PM; C, Ca2+-bound; D, DAG-bound. (H) P2Y1 activation module: Rate equations describing the interactions among ADP, P2Y1, and Gq were modeled according to the ternary complex model described by Kinzer-Ursem et al46 For clarity, DTS membrane and cytosolic compartments are not delineated. A indicates ADP; P, P2Y1; G, Gq. *Ca2+ both activates and inhibits IP3R.25
Clearly, the model does not include all of the reactions that govern platelet homeostasis and activation. Such a list is both unavailable and intractable to deploy until a core set of modules can be validated, which is the focus of this study. We have focused on the subset of reactions that govern ADP-mediated phosphoinositide signaling and mobilization of intracellular Ca2+ (Table 1). The P2Y1 receptor is coupled primarily to the Gq family of G proteins,20,21 which activate the beta-isoform of phospholipase C.1,20 Previous work has shown that this pathway accounts for more than 90% of the ADP-mediated Ca2+ signaling in platelets.22 To eliminate Ca2+ influx and the need to model store-operated Ca2+ entry, we used experimental data from studies in which extracellular Ca2+ was removed by ethylenediaminetetraacetic acid (EDTA) or another chelating agent. EDTA was also used in our own experiments. ADP releases Ca2+ only from the DTS23 ; thus, modeling the acidic store is not required at this point.
Platelet Ca2+ balance
The Ca2+ module addresses a fundamental question of what resting level of IP3 is needed to balance the open probability of IP3R channels with SERCA in a platelet of a given DTS volume and [Ca2+]dts. Our strategy for modeling platelet Ca2+ signaling can be summarized in 2 steps: First, we considered the kinetic properties of the IP3R and SERCA,24-26 the resting Ca2+i concentration,2 and the volume of the platelet27 to be accurate as reported. These values were held fixed in the module. Second, we generated more than 109 combinations of the unknown values in the module (number of IP3R/platelet, SERCA pumps/platelet, [Ca2+]dts, volume of the DTS) to find a set of “configurations” that reached an equilibrium state with the known resting [Ca2+]i (“Module calibration and analysis”). Each configuration may be thought of as a unique platelet model with a characteristic compartmental structure and molecular makeup (eg, different numbers of SERCAs, IP3Rs, etc). Note that more than one module configuration can produce the same resting [Ca2+]i.
Existing kinetic, electrochemical, and physiologic data were incorporated into the module as follows: Resting platelets maintain a [Ca2+]i between 40 and 100 nM2,18 while storing concentrated Ca2+ ([Ca2+]dts) in the DTS.2 Pumping of Ca2+ by SERCA isoforms (Figure 2E) was modeled according to a kinetic study of the type 3 SERCA isoform,24 which is abundant in human platelets.28 For the IP3R,25 each subunit of the type 2 receptor exists in one of 6 states: native, open, shut, active, or 2 inactive states (Figure 2F), where state transitions depend on [IP3] and [Ca2+]i. The channel open probability (Po) is determined by the number of IP3R tetramers with all subunits in either open or active conformations (Table 1). We used the Nernst equation29 to relate Po to the release of Ca2+ from the DTS:
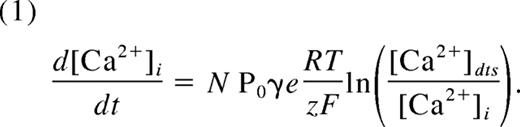
Here, N is the total number of channels per platelet, γ is the single-channel conductance (10 pS) of the platelet IP3R,26 and e is the number of elementary charges (z) per second per Ampere (6.24 × 10¹⁸). The cytosolic volume of the platelet is approximately 6 fL.27
The unknown quantities in the module were the number of IP3R and SERCA per platelet, [Ca2+]dts, and the volume of the DTS. The range of values sampled for each quantity is shown in Figure 3A. A dense sampling (n = 109) of these quantities generated 100 000 unique configurations of the Ca2+ module (with [Ca2+]i = 100 ±10 nM) that were further divided into 3 groups (low-, mild-, and high-response) based on the estimated [Ca2+]dts, an indicator of the configuration's response to an increase in [IP3] (Figure 3B). To examine any molecular or structural differences among low-, mild-, and high-response groups, we compared the levels of SERCA, IP3R, IP3, and relative DTS volume that were estimated for each group. These values are presented as probability distributions (Figure 3C), where regions of high density reflect frequently occurring values for the estimated concentrations and compartment sizes. For example, low response configurations tended to have approximately 1000 IP3R channels per platelet as indicated by red regions (Figure 3B). We note that, of 109 sampled configurations, only 0.005% satisfied the dual constraints of steady-state Ca2+ homeostasis and IP3 responsiveness (mild- or high-response configurations). This observation indicated that the kinetic properties of Ca2+-regulating enzymes such as IP3R and SERCA alone place strong constraints on the physical size and molecular makeup of the platelet.
![Figure 3. Estimation and analysis of platelet Ca2+ regulation. Unknown concentrations and compartment sizes in the platelet Ca2+ module were estimated by randomly sampling the unknown quantities in panel A and selecting only those molecular “configurations” that produced a resting [Ca2+]i of 100 plus or minus 10 nM. (B) This reduced set of configurations was divided into 3 groups based on the estimated [Ca2+]dts (top), which corresponded to the [Ca2+]i release behavior after a 10-fold increase in [IP3] (bottom). (C) Probability distributions for estimates of SERCA, IP3R, IP3, and the relative DTS volume in low-, mild-, and high-response configurations (n = 100 000). The measured IP3 level from resting platelets31 is boxed. (D) Image obtained from glucose-6-phosphatase stain of the DTS from a human platelet16 was used to quantify the cytosolic (gray) and DTS (black) area from a 2D section of the platelet.](/view-large/figure/8117256/zh80180824300003.jpeg)
Estimation and analysis of platelet Ca2+ regulation. Unknown concentrations and compartment sizes in the platelet Ca2+ module were estimated by randomly sampling the unknown quantities in panel A and selecting only those molecular “configurations” that produced a resting [Ca2+]i of 100 plus or minus 10 nM. (B) This reduced set of configurations was divided into 3 groups based on the estimated [Ca2+]dts (top), which corresponded to the [Ca2+]i release behavior after a 10-fold increase in [IP3] (bottom). (C) Probability distributions for estimates of SERCA, IP3R, IP3, and the relative DTS volume in low-, mild-, and high-response configurations (n = 100 000). The measured IP3 level from resting platelets31 is boxed. (D) Image obtained from glucose-6-phosphatase stain of the DTS from a human platelet16 was used to quantify the cytosolic (gray) and DTS (black) area from a 2D section of the platelet.
Estimation and analysis of platelet Ca2+ regulation. Unknown concentrations and compartment sizes in the platelet Ca2+ module were estimated by randomly sampling the unknown quantities in panel A and selecting only those molecular “configurations” that produced a resting [Ca2+]i of 100 plus or minus 10 nM. (B) This reduced set of configurations was divided into 3 groups based on the estimated [Ca2+]dts (top), which corresponded to the [Ca2+]i release behavior after a 10-fold increase in [IP3] (bottom). (C) Probability distributions for estimates of SERCA, IP3R, IP3, and the relative DTS volume in low-, mild-, and high-response configurations (n = 100 000). The measured IP3 level from resting platelets31 is boxed. (D) Image obtained from glucose-6-phosphatase stain of the DTS from a human platelet16 was used to quantify the cytosolic (gray) and DTS (black) area from a 2D section of the platelet.
Configurations with a negligible gradient ([Ca2+]dts ∼ 100 nM) lacked IP3 responsiveness and had relatively low SERCA levels (67% had < 5000 copies) with a median estimate of 1600 IP3R channels/platelet. By contrast, mild-response configurations ([Ca2+]dts < 10 μM) responded to elevated [IP3] with a transient rise in [Ca2+]i and were characterized by high SERCA levels (∼ 106/cell) and higher IP3R abundance (median, 2000 channels/cell). High-response configurations ([Ca2+]dts > 10 μM) clustered near 106 SERCA pumps but showed a broad distribution of IP3R abundance. The calculated IP3R/SERCA ratio for low-response configurations had a loosely defined distribution, whereas the mild- and high-response configurations favored 103 to 105 more pumps than channels (1:6900 for mild-response and 1:5200 for high-response). Thus, the model predicted a very low IP3R/SERCA ratio for functioning platelets, a hypothesis supported by noting that a single SERCA3b pump operating at a membrane with a 1000-fold Ca2+ gradient transports approximately 0.4 Ca2+ ions/second,24 whereas a single type 2 IP3R channel in the same membrane at 37° conducts approximately 3000 Ca2+ ions/second, assuming a steady-state Po of 0.0005.25
The low-response configurations harbored high resting concentrations of IP3, inconsistent with a resting platelet.30 The median IP3 count for mild-response configurations was 750 molecules/cell, similar to the measured value (∼ 1200 molecules/platelet or ∼ 200 nM)31 in resting platelets. More than 80% of high-response configurations harbored less than 1000 IP3 molecules/cell in resting platelets. The relative volume of the DTS compartment to cytosol, as predicted from the estimation procedure, was quite constrained at 0.5% to 5% (median, 2%) of the nongranular intracellular volume. To compare this result to a direct physical observation, we quantified the relative area of the platelet DTS as revealed by glucose-6-phosphatase staining.16 This calculation gave a DTS/cytosol fraction of 4.3%. Assuming the stained region marks the true DTS border, this estimate is accurate within a factor of 2 (“Platelet image analysis”). Thus, estimates obtained from independent kinetic calculations or image analysis of stained platelets gave similar values for the DTS compartment volume fraction.
PI metabolism
PIs are continuously interconverted in platelets, even under resting conditions.2,30,32 To capture this behavior, we used a set of synthesis and degradation reactions that continuously recycles PIs in the absence of a stimulating dose of agonist (Figure 2B; Table 1). Failure to account for PI resynthesis would have prevented prediction of steady-state concentrations. Using the same strategy for modeling platelet Ca2+ regulation (“Platelet Ca2+ balance”), we generated 10 000 unique PI module configurations that were consistent with the measured resting concentrations of PtdIns, PIP, PIP2, DAG, and PA.32-34 Thus, each configuration represents a potential molecular arrangement of PIs in the platelet that is consistent with published kinetic rates and resting measurements for key membrane phospholipids.
To examine the transient behavior of the PI module under activating conditions, we set the concentration of PLC-β* in the module to 1 μM (∼ 100-fold above basal levels). Figure 4A compares the measured and simulated changes in the platelet PIs after treatment with thrombin or elevated PLC-β*, respectively (both thrombin and ADP signal through Gq-mediated stimulation of PLC-β1 ). The simulated time course for PtdIns degradation was consistent with experiment throughout the 90-second interval after activation. Simulated levels of PIP and PIP2 were consistent with experiments32 through the first 25 seconds (Figure 4A). After this time, PIP and PIP2 continued to be degraded in the simulation but were sustained, or slightly elevated, in thrombin-stimulated platelets. A recent study in murine megakaryocytes35 has confirmed that resynthesis of PIP2 is necessary to replenish basal levels after agonist stimulation, a feature that is included in the model. However, because the rate of hydrolysis exceeds the rate of PI synthesis, we observed a monotonic decrease in PIs when the level of PLC-β* was held fixed. To address this discrepancy between model and experiment, we introduced a negative-feedback module (Figure 2C) in which the activity of PLC-β* is attenuated by activated PKC (PKC*) through phosphorylation of the phospholipase.
![Figure 4. Comparison of PI and P2Y1 modules to experimental data. (A) At t = 0, platelets were treated with 27 nM of thrombin, and the levels of PtdIns, PIP, and PIP2 were measured (data obtained from Wilson et al32). To simulate this turnover in the PI module, [PLC-β*] was raised to 1 μM and PI levels were calculated over time. Average results from 100 simulations are plotted as solid lines. (B,C) Kinetic parameters in the P2Y1 module were fit to GTP hydrolysis measurements from proteoliposome assay containing 300 nM of P2Y1, 1 μM of Gα·GDP, 3 μM of Gβγ, 2 μM of GTP, RGS4, and 2MeSADP (data obtained from Waldo and Harden21). Best-fit simulation results are plotted as solid lines. (B) Time-course GTPase activity is shown with (■) or without (□) 100 nM of RGS4. (C) P2Y1 dose-response to 2MeSADP in the absence (□) or presence (■) of 100 nM of RGS4. In the final platelet model, Kd and kcat values for ADP-binding and PLC-β-mediated hydrolysis, respectively, were substituted for the 2MeSADP- and RGS4-mediated activities used in the calibration procedure shown here.](/view-large/figure/8117262/zh80180824300004.jpeg)
Comparison of PI and P2Y1 modules to experimental data. (A) At t = 0, platelets were treated with 27 nM of thrombin, and the levels of PtdIns, PIP, and PIP2 were measured (data obtained from Wilson et al32 ). To simulate this turnover in the PI module, [PLC-β*] was raised to 1 μM and PI levels were calculated over time. Average results from 100 simulations are plotted as solid lines. (B,C) Kinetic parameters in the P2Y1 module were fit to GTP hydrolysis measurements from proteoliposome assay containing 300 nM of P2Y1, 1 μM of Gα·GDP, 3 μM of Gβγ, 2 μM of GTP, RGS4, and 2MeSADP (data obtained from Waldo and Harden21 ). Best-fit simulation results are plotted as solid lines. (B) Time-course GTPase activity is shown with (■) or without (□) 100 nM of RGS4. (C) P2Y1 dose-response to 2MeSADP in the absence (□) or presence (■) of 100 nM of RGS4. In the final platelet model, Kd and kcat values for ADP-binding and PLC-β-mediated hydrolysis, respectively, were substituted for the 2MeSADP- and RGS4-mediated activities used in the calibration procedure shown here.
Comparison of PI and P2Y1 modules to experimental data. (A) At t = 0, platelets were treated with 27 nM of thrombin, and the levels of PtdIns, PIP, and PIP2 were measured (data obtained from Wilson et al32 ). To simulate this turnover in the PI module, [PLC-β*] was raised to 1 μM and PI levels were calculated over time. Average results from 100 simulations are plotted as solid lines. (B,C) Kinetic parameters in the P2Y1 module were fit to GTP hydrolysis measurements from proteoliposome assay containing 300 nM of P2Y1, 1 μM of Gα·GDP, 3 μM of Gβγ, 2 μM of GTP, RGS4, and 2MeSADP (data obtained from Waldo and Harden21 ). Best-fit simulation results are plotted as solid lines. (B) Time-course GTPase activity is shown with (■) or without (□) 100 nM of RGS4. (C) P2Y1 dose-response to 2MeSADP in the absence (□) or presence (■) of 100 nM of RGS4. In the final platelet model, Kd and kcat values for ADP-binding and PLC-β-mediated hydrolysis, respectively, were substituted for the 2MeSADP- and RGS4-mediated activities used in the calibration procedure shown here.
Signal attenuation
As noted in the analysis of PI metabolism, the degradation of PIs in platelets after PLC-β activation does not decrease monotonically.2,32 Furthermore, the sharp rise in [IP3] and [Ca2+i] after GPCR stimulation returns to near-basal levels within 30 to 60 seconds.36 This negative-feedback mechanism was modeled by allowing direct inactivation of PLC-β by PKC through a phosphorylation reaction, which has been observed in several cell types.37,38 In the PKC module (Figure 2C), activation of the kinase requires association with Ca2+i and DAG and translocation to the PM.39 Activated PKC (PKC*) phosphorylates PLC-β, rendering it unable to bind Gq-GTP. Clearly, this represents only one of several potential mechanisms for regulation of Gq-dependent PI hydrolysis in platelets. Other mechanisms include receptor internalization,40 deactivation of G proteins,1 and accelerated dephosphorylation of IP3.41 Although these mechanisms will provide useful contributions to future iterations of the platelet model, it is interesting that the use of PLC-β regulation was sufficient to reproduce the observed attenuation in PI signaling after agonist stimulation (Figure 5C,D). Specifically, the gradual accumulation of Ca2+ and DAG during the first 10 to 15 seconds provides the appropriate time delay for shutting off PIP2 hydrolysis.
![Fig. 5. ADP dose response for the full platelet model. (A) Relative fluorescence of Fluo-4–loaded human platelets was measured after treatment with 100 nM, 1 μM, or 10 μM ADP. (B-F) After 1 minute of simulated rest, the platelet model was activated by setting the extracellular [ADP] to 100 nM, 1 μM, or 10 μM. Deterministic computation of (B) [Ca2+]i, (C) [IP3], (D) [PLC-β*], (E) deactivated [PLC-β], and (F) activated [Gq·GTP]. (G,H) Gel-filtered human platelets were activated with ADP and maximal changes in (G) [Ca2+]i and (H) [IP3] from basal levels were measured.36 For panels G and H, simulated responses are plotted in red.](/view-large/figure/8117265/zh80180824300005.jpeg)
ADP dose response for the full platelet model. (A) Relative fluorescence of Fluo-4–loaded human platelets was measured after treatment with 100 nM, 1 μM, or 10 μM ADP. (B-F) After 1 minute of simulated rest, the platelet model was activated by setting the extracellular [ADP] to 100 nM, 1 μM, or 10 μM. Deterministic computation of (B) [Ca2+]i, (C) [IP3], (D) [PLC-β*], (E) deactivated [PLC-β], and (F) activated [Gq·GTP]. (G,H) Gel-filtered human platelets were activated with ADP and maximal changes in (G) [Ca2+]i and (H) [IP3] from basal levels were measured.36 For panels G and H, simulated responses are plotted in red.
ADP dose response for the full platelet model. (A) Relative fluorescence of Fluo-4–loaded human platelets was measured after treatment with 100 nM, 1 μM, or 10 μM ADP. (B-F) After 1 minute of simulated rest, the platelet model was activated by setting the extracellular [ADP] to 100 nM, 1 μM, or 10 μM. Deterministic computation of (B) [Ca2+]i, (C) [IP3], (D) [PLC-β*], (E) deactivated [PLC-β], and (F) activated [Gq·GTP]. (G,H) Gel-filtered human platelets were activated with ADP and maximal changes in (G) [Ca2+]i and (H) [IP3] from basal levels were measured.36 For panels G and H, simulated responses are plotted in red.
Receptor activation
P2Y1 is a GPCR expressed on the surface of human platelets (∼ 150 copies/platelet42 ) that is essential for ADP-induced platelet shape change and aggregation.20 Although other ADP receptors are involved in platelet Ca2+ signaling (eg, P2 × 1 and P2Y12), P2Y1 contributes more than 90% of the Ca2+ signal.22 In our representation of P2Y1 activation (Figure 2D,H), binding of extracellular ADP to P2Y1 leads to activation of Gq through GDP/GTP exchange reactions. Gq-GTP is a substrate for GTPase activating proteins (GAPs), such as PLC-β and RGS4, which can accelerate Gq-GTP hydrolysis more than 1000-fold.43 Bornheimer et al showed that the combination of G proteins, active GPCRs, and GAPs can form kinetic “ternary” modules with distinct signaling patterns.4 Thus, we used results from a published in vitro assay of P2Y1 activity to construct a ternary model of the P2Y1 receptor. In that assay, Waldo and Harden combined purified human P2Y1, ADP, Gα and Gβγ subunits, PLC-β or RGS4, and radiolabeled GTP in large phospholipid vesicles and measured the agonist binding and Gq-stimulating activities of the receptor.21 GTPase activity was measured with and without agonist (Figure 4B). ADP dose-response was measured with and without GAP protein (Figure 4C). Using identical simulated conditions, we obtained the kinetic parameters in the P2Y1 module from these time-course measurements. The kinetic rate constants, given in Table 1, accurately reproduced both sets of measurements (Figure 4B,C).
Signaling in platelet populations
The 4 signaling modules (Figure 2A-D) were merged into a single kinetic model using a bootstrap method (Figure S1). With a fixed reaction network (Figures 1,2) and fixed kinetic rate constants (Table 1), ICs were fit to dose-response [Ca2+]i time-course data from ADP-stimulated platelets (Figure 5A,B). In the presence of basal ADP levels similar to human venous plasma,44 the model maintained a resting [Ca2+]i of 75 nM (Figure 5B). At higher ADP concentrations, [Ca2+]i reached peak levels approximately 20 seconds after addition of agonist with a decay constant of approximately 1 minute. We found the synchronous [Ca2+]i peak-response at all agonist doses to be a complex and unique feature in the data, particularly well suited for testing model validity. Achieving this characteristic shape required a transient (nonmonotonic) rise in [IP3]. In ADP- and thrombin-stimulated platelets,36,45 [IP3] increases rapidly after agonist addition, peaks around 15 seconds, and then decreases to near-basal levels. The model predicted this behavior accurately (Figure 5C). We observed that PLC-β*, which comprised approximately 0.2% of the total PLC-β pool in the model, strongly controlled this rise and fall of [IP3] (Figure 5C,D). Phosphorylation of inactive PLC-β by PKC* (Figure 5E) was sufficient to dampen Gq-mediated PI hydrolysis. The simplicity of this negative-feedback model suggests a mechanism whereby the phosphorylation of inactive PLC-β, present at much higher abundance than PLC-β*, fine-tunes the hydrolytic activity of the enzyme by sequestering it from Gq-GTP. Addition of ADP caused a sharp burst in [Gq-GTP] that saturated within 5 to 10 seconds for all doses (Figure 5F). This trend was consistent with the observed time-scale for G protein activation.46 Maximal [Ca2+]i and [IP3] responses to increasing ADP were predicted quantitatively (Figure 5G,H).
Signaling in individual platelets
Deterministic simulations, such as those in Figure 5B through F, resemble data obtained from suspensions of platelets (Figure 5A), in which a million or more cells may be assayed simultaneously. These conditions often produce average or “smooth” responses that are typical of cell populations. However, when platelets are monitored individually, the addition of agonist can produce a series of sharp, asynchronous Ca2+ spikes.18,47 To test the single-platelet response in the model, we used the Stochastic Simulation Algorithm48 to simulate Ca2+ release in a single platelet during rest or activation by ADP. Using the estimated sizes of the platelet compartments, species concentrations were converted to integer values for use in the stochastic simulation. Note that any species present at 1 nM in a 6-fL platelet constitutes less than 4 molecules, a level that can give rise to stochastic fluctuations.
Dramatic, asynchronous [Ca2+]i spikes increased in frequency and amplitude after activation with ADP (Figure 6A,B). Before agonist stimulation, the resting platelet model showed occasional Ca2+ spikes with relatively small amplitude. Similar behavior was noted in a third of recorded platelets,47 which spiked on average 1.6 (± 0.2) minutes without ADP stimulation. The onset of Ca2+ release after agonist addition was rapid in the model (∼ 5 seconds) and persisted for several minutes, also consistent with experimental results.18,47 Key drivers in this asynchronous spiking were the channel open probability, the low copy number of IP3R channels, the size of the cytosolic compartment (8 fL in the model), and the large Ca2+ gradient at the DTS membrane. To determine the frequency distribution of Ca2+ spiking, we followed exactly the empirical strategy used by Heemskerk et al18 to distinguish individual Ca2+ release events in a detailed study of video-imaged platelets (Figure S3). There was a striking resemblance between simulation and experiment for the peak interval distribution (Figure 6C), with the most common intervals occurring at 6 to 8 seconds or 11 to 13 seconds. Because platelet volume was artificially increased 100-fold in the stochastic simulation (Figure 6D), the Ca2+ spiking was lost and typical, smooth ADP responses (as in Figure 5B) for populations emerged. Thus, the asynchronous spiking appeared to be a result of the fundamentally stochastic nature of signal transduction in cells as small as human platelets.
![Figure 6. Stochastic simulation of a single platelet. (A) A single, fura-2–loaded platelet was immobilized on a fibrinogen-coated coverslip and activated with 40 μM ADP at t = 90. Ca2+i trace was obtained from Heemskerk et al.47 (B) After 90 se-conds of simulated rest, the platelet model was activated by setting extracellular [ADP] to 40 μM. [Ca2+]i was sampled every 0.1 second. (C) Single platelets were simulated for 10 minutes, and [Ca2+]i was sampled once per second. Ca2+ peaks were identified as described by Heemskerk et al.18 Peak intervals between 5 and 30 seconds were counted from 10 simulations as described for video-imaging studies (Supplemental data). Interval times were binned in 2-second increments for direct comparison with experiment (inset). (D) The platelet model compartment sizes were artificially scaled to 1, 10, or 100 times their original sizes. Simulation results are shown for 300-second stochastic simulations with 20 μM of ADP added at 90 seconds. The bottom plot shows results for the deterministic simulation.](/view-large/figure/8117273/zh80180824300006.jpeg)
Stochastic simulation of a single platelet. (A) A single, fura-2–loaded platelet was immobilized on a fibrinogen-coated coverslip and activated with 40 μM ADP at t = 90. Ca2+i trace was obtained from Heemskerk et al.47 (B) After 90 se-conds of simulated rest, the platelet model was activated by setting extracellular [ADP] to 40 μM. [Ca2+]i was sampled every 0.1 second. (C) Single platelets were simulated for 10 minutes, and [Ca2+]i was sampled once per second. Ca2+ peaks were identified as described by Heemskerk et al.18 Peak intervals between 5 and 30 seconds were counted from 10 simulations as described for video-imaging studies (Supplemental data). Interval times were binned in 2-second increments for direct comparison with experiment (inset). (D) The platelet model compartment sizes were artificially scaled to 1, 10, or 100 times their original sizes. Simulation results are shown for 300-second stochastic simulations with 20 μM of ADP added at 90 seconds. The bottom plot shows results for the deterministic simulation.
Stochastic simulation of a single platelet. (A) A single, fura-2–loaded platelet was immobilized on a fibrinogen-coated coverslip and activated with 40 μM ADP at t = 90. Ca2+i trace was obtained from Heemskerk et al.47 (B) After 90 se-conds of simulated rest, the platelet model was activated by setting extracellular [ADP] to 40 μM. [Ca2+]i was sampled every 0.1 second. (C) Single platelets were simulated for 10 minutes, and [Ca2+]i was sampled once per second. Ca2+ peaks were identified as described by Heemskerk et al.18 Peak intervals between 5 and 30 seconds were counted from 10 simulations as described for video-imaging studies (Supplemental data). Interval times were binned in 2-second increments for direct comparison with experiment (inset). (D) The platelet model compartment sizes were artificially scaled to 1, 10, or 100 times their original sizes. Simulation results are shown for 300-second stochastic simulations with 20 μM of ADP added at 90 seconds. The bottom plot shows results for the deterministic simulation.
Discussion
We deployed available kinetic data, electrochemical calculations, measurements of cell size, and modular organization of signaling function to estimate the physical structure and dynamical properties of ADP-stimulated Ca2+ release in human platelets. For the first time, a single model has accounted for several fundamental attributes of known platelet behavior: (1) In the presence of basal ADP levels, the model remained at steady state and accurately predicted the resting concentrations of Ca2+i, IP3, DAG, PA, PI, PIP, and PIP2. Under these conditions, the model underwent slow turnover of signaling molecules (eg, IP3, PLC*, and Gq-GTP), yet the rates of synthesis and degradation of these metabolites were exactly balanced. At the same time, Ca2+ was continuously leaked from the DTS and actively pumped back into stores, maintaining a resting platelet [Ca2+]i near 100 nM. This “active” homeostatic state is representative of the situation in vivo because inhibition of SERCA pumps causes a gradual depletion of Ca2+ stores.2 (2) Increased [ADP] caused a transient rise in [Ca2+]i and [IP3] with the correct dose-response and time-course profiles. (3) Stochastic simulation of the platelet model generated noisy Ca2+ release and reuptake behavior with a nearly instantaneous onset. (4) Calculation of peak-to-peak interval times revealed a distribution of intervals favoring 6- to 8- and 11- to 13-second gaps. These results were strikingly similar to what was observed in video-imaged platelets and demonstrate that both averaged and stochastic behaviors may be accurately captured by the same molecular model. Importantly, the model fulfilled the dual requirement of maintaining homeostasis under resting conditions while remaining capable of generating an activation response in the presence of sufficiently high agonist concentration. This is a critical quality to consider when modeling platelets, which must be sensitive enough to respond to injury without activating prematurely.1,2
Our analysis also produced several novel predictions: (1) The number of SERCA pumps was predicted to outnumber IP3R channels (< 5000 IP3R copies were predicted in most configurations). This was largely a consequence of the kinetic properties of the enzymes, which transport Ca2+ at significantly different rates. (2) The relative volume of the platelet DTS was predicted to be 2% to 4% of the nongranular intracellular volume, both by kinetic modeling and image analysis of a DTS-stained platelet. (3) Lower resting [IP3] was associated with greater [Ca2+]dts and more acute Ca2+ release. (4) Restoration of basal PI levels after PLC-β* hydrolysis was predicted to occur in part through a negative-feedback mechanism in which PKC* phosphorylates PLC-β and thereby diminishes its hydrolytic activity. (5) By artificially increasing the volume of the simulated platelet, we were able to quench the fluctuation of Ca2+ spikes, achieving a response more similar to that of megakaryocytes, in which regular oscillations in [Ca2+]i are observed with fixed amplitude and frequency.49 Because mature megakaryocytes are more than 1000 times larger than platelets,50 these observations suggest that the asynchronous and stochastic Ca2+ response in platelets may simply be the consequence of a small intracellular volume.
The model also provided some insight into why thrombin is a more potent agonist than ADP. Both agonists act through Gq-coupled GPCRs,1 yet there are about 10 times as many thrombin receptors as ADP receptors.1,42 To determine whether the increased potency of thrombin may be the result of greater receptor surface expression, we increased the number of P2Y1 receptors in the model and examined the ADP response. A 10-fold increase in [P2Y1] caused a 2-fold higher peak response and more sustained elevation of [Ca2+]i (Figure S4), similar to the observed difference between thrombin- and ADP-stimulated platelets. Although a more thorough analysis will involve examining the coupling efficiency to Gq and the duration of the receptor active state, these calculations imply that the low copy number of P2Y1 may be a limiting factor for ADP signaling.
Our estimation procedure generated 10 individual platelet models (unique sets of ICs representing the resting concentrations for the 70 species in the model) that each satisfied homeostasis constraints and fit all available data (Figure S5). These models may be thought of as individual cells in a platelet population that vary in their exact molecular makeup but are each capable of generating the same activation response. For certain species such as Ca2+i, DAG, and PIP2, the similarity among the models can be easily explained because these quantities were held fixed (with a small variability term) to the values reported in the literature. Other similarities in the concentrations, as for GTP and PLC-β*, are more interesting because these values were not explicitly restricted by the estimation procedure. Rather, these uniformities reflect implicit constraints in the platelet model that emerged because of other species concentrations or signaling reactions that strongly control the production or consumption of these species. As such, these quantities are predicted to be rigid, or inflexible, “nodes” in the model8 and are subject to further investigation as a new hypothesis revealed by the analysis. By contrast, we observed several instances of variability in concentrations (node flexibility) among the 10 models. For example, the concentrations of PKC and Gq-GTP both varied over 3 orders of magnitude. Similarly, the values for P2Y1, SERCA, PMCA, PLC-β, Ins, IP2, and CDP-DAG varied appreciably. The large variability observed for many of the estimated phospholipids (eg, Ins, IP2, and CDP-DAG) was the result of allowable node flexibility and/or insufficient experimental data to constrain the estimation of the resting concentrations. Thus, whereas the essential steady-state and activation properties were accurately captured by the module as a whole (Figure 4A), additional experimental data will be necessary to generate reliable estimates for individual phosphoinositides. Finally, the estimated number of IP3R channels was generally low (< 2500 channels/cell) as expected from the analysis of the Ca2+ module. Higher [Ca2+]dts appeared to be compensated by higher SERCA levels.
Through a computational analysis of the human platelet, we have demonstrated the successful integration of heterogeneous datasets and legacy knowledge to construct a predictive model of platelet homeostasis and activation. This assembly of molecular detail represents, for the first time, a substantial description of the platelet signaling apparatus and was capable of reproducing diverse experimental observations as well as providing specific, testable hypotheses regarding platelet enzymatic regulation, the physical structure of the cell, and the dynamics of intracellular calcium release. Specifically, this is the first work to provide a quantitative molecular explanation of the asynchronous calcium spiking observed in stimulated human platelets. By incorporating additional experimental data, future versions of the model can include mechanisms for store-operated Ca2+ influx mechanisms, the acidic Ca2+ store, integrin activation, granule secretion, phosphatidylserine exposure, as well as additional receptors for prostacyclin, nitric oxide, thromboxane, epinephrine, thrombin, fibrinogen, and collagen. As experimental investigation of platelet function continues, new data will be used to challenge, confirm, and expand the platelet signaling model presented here.
An Inside Blood analysis of this article appears at the front of this issue.
The online version of this article contains a data supplement.
The publication costs of this article were defrayed in part by page charge payment. Therefore, and solely to indicate this fact, this article is hereby marked “advertisement” in accordance with 18 USC section 1734.
Acknowledgments
The authors thank Ravi Radhakrishnan for help with model reduction and estimation methods.
This work was supported by the National Institutes of Health (grants R01-HL-56 621 and R33-HL-87 317; S.L.D., L.F.B.).
National Institutes of Health
Authorship
Contribution: S.L.D., L.F.B., and J.E.P. designed the research and prepared the manuscript; M.S.C. measured ADP-induced Ca2+ release; and J.E.P. performed model constructions and simulations.
Conflict-of-interest disclosure: The authors declare no competing financial interests.
Correspondence: Scott L. Diamond, 1020 Vagelos Research Laboratories, 3340 Smith Walk, Philadelphia, PA 19104; e-mail: sld@seas.upenn.edu.

This feature is available to Subscribers Only
Sign In or Create an Account Close Modal