

Abstract
Memory B cells latently infected with Epstein-Barr virus (mBLats) in the blood disappear rapidly on presentation with acute symptomatic primary infection (acute infectious mononucleosis [AIM]). They undergo a simple exponential decay (average half-life: 7.5 ± 3.7 days) similar to that of normal memory B cells. The cytotoxic T lymphocyte (CTL) response to immediate early (IE) lytic antigens (CTLIEs) also decays over this time period, but no such correlation was observed for the CTL response to lytic or latent antigens or to the levels of virions shed into saliva. We have estimated the average half-life of CTLIEs to be 73 (± 23) days. We propose that cycles of infection and reactivation occur in the initial stages of infection that produce high levels of mBLats in the circulation. Eventually the immune response arises and minimizes these cycles leaving the high levels of mBLats in the blood to decay through simple memory B-cell homeostasis mechanisms. This triggers the cells to reactivate the virus whereupon most are killed by CTLIEs before they can release virus and infect new cells. The release of antigens caused by this large-scale destruction of infected cells may trigger the symptoms of AIM and be a cofactor in other AIM-associated diseases.
Introduction
Epstein-Barr virus (EBV) is a B-lymphotropic herpesvirus that infects the majority of the human population and establishes life-long persistence in memory cells (reviewed in Thorley-Lawson1 and Thorley-Lawson and Gross2 ). The infection is usually benign but may occasionally be associated with pathogenic consequences. Thus if infection is delayed until adolescence, it results in acute infectious mononucleosis (AIM) in 20% to 50% of cases (reviewed in Vetsika and Callan3 ). AIM is a self-limiting lymphoproliferative disease characterized by fever, lymphadenopathy, and fatigue that may continue for weeks or months, and it has been suggested that AIM may permanently alter or impair the immune response.4 EBV also has the capacity to transform B cells in culture and is closely associated with several cancers including B-cell lymphomas (Hodgkin disease, and Burkitt and immunoblastic lymphomas) and carcinomas (nasopharyngeal and gastric). It has also been suggested that EBV may be linked to several autoimmune diseases.5-7 There is evidence that AIM itself rather than EBV infection, per se, is a key predisposing factor for at least some of the associated diseases.5,8 Thus an understanding of the events that occur during AIM is critical for determining what goes wrong in EBV-associated diseases
We have developed a model of how EBV establishes and maintains persistence in the peripheral blood (reviewed in Thorley-Lawson1 and Thorley-Lawson and Gross2 ; and see Figure 1). Briefly, EBV uses its different transcription programs to activate and then drive the differentiation of newly infected B-cell blasts (bBLats) into resting latently infected memory B cells (mBLats), the site of life-long persistence.1 We have further proposed that terminal differentiation of these cells into plasma cells triggers reactivation and replication of the virus.9 During AIM, the level of latently infected memory B cells (mBLats) can rise to half, and perhaps even higher, of the peripheral memory B-cell compartment.10 Detailed phenotypic and functional analysis suggests that these cells (mBLats) are indistinguishable from normal memory B cells and from the mBLats found in long-term persistent infection. They express classical markers of memory B cells (CD27+, sIgD−)10 and normal surface immunoglobulin that has undergone isotype switching and contains patterns of somatic hypermutation expected for cells having undergone antigen selection.11,12 They are also resting and latently infected but do not express virally encoded latent proteins and no lytic replication is detectable.13 Consequently they are not a pathogenic threat to the host, explaining why life-long infection with EBV is usually benign.

Schematic drawing of our model of EBV persistence. During acute infection, EBV transmitted via saliva infects naive B cells turning them into latently infected B-cell blasts (bBLats) and driving their proliferation and differentiation through a germinal center (gcBLat) into latently infected memory B cells (mBLats) that then migrate to peripheral blood where EBV persists for the lifetime of its host. When mBLats migrate back to the tonsil, they occasionally receive signals to undergo terminal differentiation into plasma B cells, which triggers reactivation of the virus. This results in the subsequent expression of lytic genes (eg, IE and EA) and ultimately production of free virions that can then infect new B cells or shed into saliva to infect new hosts. This process in turn stimulates an aggressive antiviral CTL response. The infected cells expressing targets recognized by CTLs are indicated. This response effectively reduces the number of cells that complete viral replication so that during persistent infection little or no new infection of B cells occurs. Whether the stable levels of mBLats during persistence are maintained through memory B-cell homeostasis, low-level infection of new B cells, or a combination of the 2 is unresolved.
Schematic drawing of our model of EBV persistence. During acute infection, EBV transmitted via saliva infects naive B cells turning them into latently infected B-cell blasts (bBLats) and driving their proliferation and differentiation through a germinal center (gcBLat) into latently infected memory B cells (mBLats) that then migrate to peripheral blood where EBV persists for the lifetime of its host. When mBLats migrate back to the tonsil, they occasionally receive signals to undergo terminal differentiation into plasma B cells, which triggers reactivation of the virus. This results in the subsequent expression of lytic genes (eg, IE and EA) and ultimately production of free virions that can then infect new B cells or shed into saliva to infect new hosts. This process in turn stimulates an aggressive antiviral CTL response. The infected cells expressing targets recognized by CTLs are indicated. This response effectively reduces the number of cells that complete viral replication so that during persistent infection little or no new infection of B cells occurs. Whether the stable levels of mBLats during persistence are maintained through memory B-cell homeostasis, low-level infection of new B cells, or a combination of the 2 is unresolved.
Since they express no viral proteins, we assume that mBLats are invisible to the immune response. Nevertheless, in previous studies10 we observed a rapid decline in their numbers for the 5 to 6 weeks immediately after AIM patients first come to the clinic. This decline, which appeared to follow a simple exponential kinetic, was subsequently confirmed in 2 later independent studies, although they did not study viral dynamics within single individuals.14,15 We reasoned that there were several possible explanations for the loss of mBLats (Figure 2). One possibility was that they were being culled through the same process by which an expanded acute immune response resolves back to homeostasis—these cells could simply die by apoptosis without turning on viral gene expression and therefore would not trigger an aggressive antiviral immune response. Alternatively, the mBLats were being destroyed by a cellular antiviral immune response. Since they do not express antigenic viral proteins, this would require reactivation of viral protein genes. This could occur in 2 ways. Either the cells could switch on latent protein expression or they could initiate viral replication. These mechanisms would trigger aggressive but different cytotoxic T lymphocyte (CTL) responses. In the first scenario, CTLs against latent protein targets (CTLLats) will be activated, in which case we should observe a parallel decay of mBLats and CTLLats. In the second scenario, an aggressive CTL response against viral replicative antigens should be observed that should decay in parallel with mBLats. Reactivation of EBV lytic replication is an ordered process that begins with the expression of the immediate early (IE) genes that are transcription factors but also targets of the virus-specific CTL response (CTLIEs).16 The immediate early transcription factors turn on a cascade of genes that initially replicate the virus (early antigens [EAs]) and subsequently package it (late antigens). These proteins also stimulate a CTL response including CTLEAs. The ultimate products of viral replication are virions. These may either infect other naive B cells, producing new latently infected B-cell blasts (bBLats) expressing all the known latent antigens, or be shed into saliva to allow infection of new subjects. Newly latently infected bBLats will either be killed by CTLLats or differentiate into mBLats (Figure 1).

Hypothesized mechanisms for the rapid decline of mBLats. The mBLats may simply die, perhaps via apoptosis induced by homeostatic culling. This would not stimulate a virus-specific CTL response. Alternatively, the cells may turn on viral latent proteins or initiate viral replication and be killed by CTLs.
Hypothesized mechanisms for the rapid decline of mBLats. The mBLats may simply die, perhaps via apoptosis induced by homeostatic culling. This would not stimulate a virus-specific CTL response. Alternatively, the cells may turn on viral latent proteins or initiate viral replication and be killed by CTLs.
To distinguish these different scenarios and investigate the process by which mBLats decay, we have carefully measured the decay rate of mBLats during the first 5 to 6 weeks after diagnosis of AIM in parallel with the CTL response to an immediate early and early lytic antigen (CTLIE and CTLEA) and a latent antigen (CTLLat) and with the levels of virus shed into saliva.
Methods
Patients
The patient population we used has been described previously.10 After informed consent was obtained in accordance with the Declaration of Helsinki, blood and saliva were collected at the initial visit presenting with symptoms, and then on a weekly basis for the next 6 weeks (v1-6), plus at 6 months (v7) and 1 year (v8) following initial visit (referred to as after diagnosis). These studies were approved by the Human Studies Committee, University of Massachusetts Medical School and the HIRB at Tufts University School of Medicine.
Cells and cell lines
Peripheral blood mononuclear cells (PBMCs), B cells, and memory B cells were all isolated as described previously.10 The cell line IB4 was used as an EBV-positive control for real-time DNA polymerase chain reaction (PCR). Supernatants from the EBV-positive marmoset lymphoblastoid cell line B958 were used to set up standard curves for the viral shedding assays. The mouse thymoma cell line CB59 was used as an EBV-negative control.
Limiting dilution analysis and real-time PCR
These were performed as previously detailed10 with the exception that the W repeat of the EBV genome was detected by a real-time Taqman DNA PCR assay that can detect a single copy of the EBV genome in a background of 106 EBV-negative cells. PCR was performed in a volume of 25 μL on the ABI Prism 5700 (Perkin Elmer, Waltham, MA) or MyIQ System (BioRad, Hercules, CA). Thermal cycling was initiated with a first denaturation step at 95°C for 3 minutes, and continued with 50 cycles of amplification at 95°C for 15 seconds and 60°C for 1 minute. For each reaction, 5 μL DNA template was added to a master mix containing 12.5 μL Universal TaqMan Master Mix (Applied Biosystems [Foster City, CA] or BioRad) and 2.5 μL each of the forward and reverse primers and fluorogenic probe. The primers used were AGTGGGCTTGTTTGTGACTTCA, GGACTCCTGGCGCTCTGAT and the probe used was 6-FAM-TTACGTAAGCCAGACAGCAGCCAATTGTC-TAMRA.
Viral shedding assay
Saliva samples were collected by mouth rinse and gargling with 5 mL drinking water. Samples were stored at −80°C until all time points were collected and then analyzed simultaneously. Saliva sample (100 μL) was digested overnight with proteinase K (PK) at 55°C in a 96-well plate (8-10 wells per subject per time point). The digested saliva sample (5 μL) was used as template for W Taqman DNA PCR after deactivating the PK by heating up to 95°C for 10 minutes. Duplicate serial dilutions of B958 culture supernatant, containing a previously measured number of virions, served as a standard to calculate the number of virions in the 5-mL saliva sample.
EBV-specific CD8 tetramer staining
PBMCs from AIM patients, who screened positive for expression of the HLA A2 allele, were subjected to HLA-peptide tetramer staining performed as previously described.17,18 The following peptides were used: HLA A2–restricted peptides: A2 BRLF1–1/YVLDHLIVV, A2 BMLF1/GLCTLVAML, and A2 EBNA-3C/ LLDFVRFMGV.
Results
Resolution of acute EBV infection in the blood of AIM patients
We have shown previously that there was a very rapid decline of latently infected memory B cells (mBLats) in the first 5 to 6 weeks after AIM patients report to the clinic. This was followed by a slower decline that continues for at least 1 year after diagnosis and has not dropped to the levels seen in healthy carriers (dotted line in Figure 3A), suggesting that the acute infection had still not resolved to stable persistence even by 1 year later. These observations were subsequently confirmed.14,15 The initial decline appeared to follow a simple exponential kinetic, but too few time points were taken to accurately characterize it. Therefore in this study we have performed a more detailed analysis with more time points and confirmed the previous findings (Figure 3A; Table S1, available on the Blood website; see the Supplemental Materials link at the top of the online article). We obtained sufficient data to accurately measure the early half-life of mBLats for 13 of 15 patients over the first 30 to 50 days when the cell number was undergoing a rapid decline (Table 1). In all cases, the decline followed a simple exponential decay (data for 8 representative patients are shown in Figures 3B,C,4A,5A) with half-lives ranging from 2.4 to 15.2 days with a mean of 7.5 plus or minus 3.7 days (Table 1). This is remarkably similar to the half-life reported for normal, uninfected memory B cells, of 11 plus or minus 3.3 days (range from 6-15 days)20 estimated by feeding volunteers with isotope-labeled glucose. This similarity agrees with our previous measurements showing that mBLats divide at the same rate as normal memory B cells10,21 and provides further support for our suggestion that mBLats are perceived as normal memory B cells by the host and maintained by normal homeostasis mechanisms.11

The level of infected mBLats over time in the blood of AIM patients. (A) From the time of initial visit and diagnosis to approximately 1 year for 3 patients. The dotted and unbroken horizontal lines are, respectively, the upper limit and the median values for the blood of healthy carriers (n = 30).19 (B,C) Detailed time course during the first 50 days for 6 patients. The frequency of infected cells (FOIs) is expressed as the percentage of infected memory B cells and is plotted on a log scale to demonstrate the simple exponential decay in the weeks following diagnosis.
The level of infected mBLats over time in the blood of AIM patients. (A) From the time of initial visit and diagnosis to approximately 1 year for 3 patients. The dotted and unbroken horizontal lines are, respectively, the upper limit and the median values for the blood of healthy carriers (n = 30).19 (B,C) Detailed time course during the first 50 days for 6 patients. The frequency of infected cells (FOIs) is expressed as the percentage of infected memory B cells and is plotted on a log scale to demonstrate the simple exponential decay in the weeks following diagnosis.
Half-life values of latently-infected memory B cells (mBLats) in the blood of 15 AIM patients for the first 50 days after diagnosis
| Patient | Half-Life (d) |
|---|---|
| IM1 | 11.1 |
| IM2 | 15.2 |
| IM3 | 6.6 |
| IM4* | 5.3 |
| IM5* | 6.7 |
| IM6 | 11.7 |
| IM7* | 5.4 |
| IM8* | 4.3 |
| IM9 | † |
| IM10* | 2.4 |
| IM11* | 7.5 |
| IM12* | 3.2 |
| IM13* | 9.7 |
| IM14* | 8.3 |
| IM15 | † |
| Mean | 7.5 |
| Std Dev | 3.7 |
| Patient | Half-Life (d) |
|---|---|
| IM1 | 11.1 |
| IM2 | 15.2 |
| IM3 | 6.6 |
| IM4* | 5.3 |
| IM5* | 6.7 |
| IM6 | 11.7 |
| IM7* | 5.4 |
| IM8* | 4.3 |
| IM9 | † |
| IM10* | 2.4 |
| IM11* | 7.5 |
| IM12* | 3.2 |
| IM13* | 9.7 |
| IM14* | 8.3 |
| IM15 | † |
| Mean | 7.5 |
| Std Dev | 3.7 |
These patients identified were also analyzed for their levels of CTL responses against EBV antigens and/or shed virus in saliva.
Insufficient data points (n = 2 visits) to calculate a half-life.

Correlation between the levels of mBLats and the CTL responses against lytic (IE and EA) and latent (LAT) antigens in the blood of an AIM patient (IM4) immediately following diagnosis. (A) Level over time of mBLats expressed as the log of the percentage of infected memory B cells. (B-D) Levels over time of CTL responses against IE, EA, and LAT antigens, respectively, expressed as the log of the percentages of tetramer-binding cells in the total CD8+ T-cell population. (E-G) Correlation between the frequency of mBLats and of CTL against IE, EA, and LAT antigens, respectively.
Correlation between the levels of mBLats and the CTL responses against lytic (IE and EA) and latent (LAT) antigens in the blood of an AIM patient (IM4) immediately following diagnosis. (A) Level over time of mBLats expressed as the log of the percentage of infected memory B cells. (B-D) Levels over time of CTL responses against IE, EA, and LAT antigens, respectively, expressed as the log of the percentages of tetramer-binding cells in the total CD8+ T-cell population. (E-G) Correlation between the frequency of mBLats and of CTL against IE, EA, and LAT antigens, respectively.

Correlation between the levels of mBLats, the CTL responses against lytic antigens (IE and EA) in the blood, and shed virion in the saliva of an AIM patient (IM10) immediately following diagnosis. (A) Level over time of mBLats expressed as the log of the percentage of infected memory B cells. (B,C) Levels over time of CTL responses against IE and EA antigens, respectively, expressed as the log of the percentages of tetramer-binding cells in the total CD8+ T-cell population. Note the values for CTLLats are not shown because none was detected at any time point. (D) Level of virions shed into saliva expressed as the logs of the number of virions per milliliter of saliva sample. (E) As in panel D, but from 40 days after diagnosis until approximately one year later. (F) As in panel D, but for patient IM9. (G) As in panel E, but for patient IM9.
Correlation between the levels of mBLats, the CTL responses against lytic antigens (IE and EA) in the blood, and shed virion in the saliva of an AIM patient (IM10) immediately following diagnosis. (A) Level over time of mBLats expressed as the log of the percentage of infected memory B cells. (B,C) Levels over time of CTL responses against IE and EA antigens, respectively, expressed as the log of the percentages of tetramer-binding cells in the total CD8+ T-cell population. Note the values for CTLLats are not shown because none was detected at any time point. (D) Level of virions shed into saliva expressed as the logs of the number of virions per milliliter of saliva sample. (E) As in panel D, but from 40 days after diagnosis until approximately one year later. (F) As in panel D, but for patient IM9. (G) As in panel E, but for patient IM9.
CTLIE levels also decay over time in the blood of AIM patients
By monitoring the CTL response to EBV we hoped to distinguish among the 3 scenarios described in “Introduction” (Figure 2). If mBLats were disappearing simply due to apoptosis, they should generate no viral antigens of either lytic or latent viral proteins and therefore no correlation should be seen between the level of mBLats with that of any virus-specific CTL response. Alternatively, if mBLats were turning on lytic or latent proteins, then the amount of antigen generated to stimulate a CTL response should decay as the mBLat number drops, and we might expect to see a parallel decay in the levels of mBLats and the appropriate CTL response over time. This assumes that the magnitude of the CTL response is dependent on the level of antigenic load. To investigate these possibilities we measured, over the course of 50 days after diagnosis, the levels of the CTL responses against the immediate early antigen BRLF1 (CTLIE), the early antigen BMLF1 (CTLEA), and the latent antigen EBNA3c (CTLLat), in the peripheral blood of 6 IM patients where we also measured the levels of mBLats. We then compared the variation over time of mBLats versus the CTL responses. Typical results are shown in Figure 4A-D (IM4) (see also Figure 5A-C for the data from IM10). We found that only the levels of the CTLIE response showed a significant decay that paralleled the decline seen in mBLats. By comparison, the levels of CTLEAs and CTLLats showed minimal if any decline over the same time span. The direct correlation between mBLats and CTLIEs and the lack of correlation with CTLEAs and CTLLats for the data from patient IM4 are demonstrated graphically in Figure 4E-G. The results of Spearman correlation analysis on all the parameters versus time are summarized in Table 2 for all 6 patients (see Table S1 for actual data). All 6 patients showed a highly significant negative correlation (ie, declined) with time for levels of both mBLats and CTLIEs, whereas no such correlation was found for CTLEAs (5 of 6 patients) or CTLLats (6 of 6 patients). When the same correlation analysis was performed between parameters, there was a highly significant positive correlation between the levels of mBLats and CTLIEs (Table 3) but no significant correlation between mBLats and levels of CTLEAs and CTLLats (data not shown) for all 6 patients as would be expected. These results demonstrate that only the levels of mBLats and CTLIEs undergo rapid decay over this time period and that these decays are highly correlated with each other.
Correlation coefficients (CC) and significance (p) for the variation in levels of mBLats and CTL responses in the blood and shed virus in the saliva over time
| Patient | mBLat vs Days | CTLIE vs Days | CTLEA vs Days | CTLLat vs Days | Shed virus vs Days | |||||
|---|---|---|---|---|---|---|---|---|---|---|
| CC | p | CC | p | CC | p | CC | p | CC | p | |
| IM4 | -1.0 | <.01 | -1.0 | <.01 | -0.1 | .87 | -0.1 | .87 | na | na |
| IM5 | -1.0 | <.01 | -1.0 | <.01 | -0.8 | .2 | -0.3 | .68 | na | na |
| IM7 | -1.0 | <.01 | -1.0 | <.01 | 0.4 | .6 | -0.6 | .37 | na | na |
| IM8 | -1.0 | <.01 | -1.0 | <.01 | 0.4 | .6 | 0.1 | .9 | na | na |
| IM10 | -1.0 | <.01 | -1.0 | <.01 | -0.5 | .7 | na | na | 0.6 | .4 |
| IM11 | -1.0 | <.01 | -1.0 | <.01 | -1.0 | <.01 | -0.5 | .67 | -0.8 | .2 |
| IM12 | -1.0 | <.01 | na | na | na | na | na | na | -0.5 | .7 |
| IM13 | -1.0 | <.01 | na | na | na | na | na | na | -0.6 | .3 |
| IM14 | -1.0 | <.01 | na | na | na | na | na | na | -0.5 | .7 |
na indicates not available.
Correlation coefficients (CC) and significance (p) for the variation in levels of mBLat versus CTLIE response in the blood of 6 AIM patients for the first 50 days after diagnosis
| Patient | CTLIE vs mBLat | |
|---|---|---|
| CC | P | |
| IM4 | 0.975 | <.01 |
| IM5 | 1.0 | <.01 |
| IM7 | 1.0 | <.01 |
| IM8 | 1.0 | <.01 |
| IM10 | 1.0 | <.01 |
| IM11 | 1.0 | <.01 |
| Patient | CTLIE vs mBLat | |
|---|---|---|
| CC | P | |
| IM4 | 0.975 | <.01 |
| IM5 | 1.0 | <.01 |
| IM7 | 1.0 | <.01 |
| IM8 | 1.0 | <.01 |
| IM10 | 1.0 | <.01 |
| IM11 | 1.0 | <.01 |
There is no correlation between the levels of mBLats in the blood and virus shed into the saliva of AIM patients over time
The observations described in the previous section are consistent with a model that suggests that mBLats in the peripheral blood are disappearing by entering into viral replication and being killed by CTLIEs before they can progress any further with only a small and relatively stable number completing the lytic cycle and releasing infectious virus to infect new cells. As shown in Figure 2, the link between cells undergoing viral replication and newly infected B-cell blasts is infectious-free virus. If the model described above is correct, it would predict that virus shedding in saliva should be relatively stable by the time AIM patients arrive at the clinic, while the levels of mBLats are falling exponentially.
To test this prediction, we measured the levels of shed virus in saliva over time for 5 AIM patients, from 2 of whom we also had CTL data available (IM10 and IM11). Data for one patient (IM10) is shown in Figure 5A-D (a 25-day analysis in Figure 5A). The statistical analysis for all 5 patients studied is summarized in Table 2 (see Table S1 for actual data). For all 5 patients, there was no significant change in the levels of virus shedding over the time period studied. This result confirms similar observations that were reported by 2 other groups,14,15 while our study was ongoing and supports our hypothesis that the number of mBLats that successfully complete viral reactivation to infect new B cells is already relatively stable by the time that AIM patients arrive in the clinic.
Virus shedding during AIM and in recovery
We have shown that the kinetics of virus shedding in saliva and mBLat levels in the blood are diametrically opposite during the early stages of the disease with the former being relatively stable and the later dropping rapidly. To test if this discrepant behavior continued into persistence, we followed virus shedding in AIM patients for 1 year and compared the kinetics to that seen in mBLats. Shedding data out to one year is shown for IM10 and IM9 in Figure 5E and G adjacent to the short-term shedding graphs (Figure 5D and F, respectively) for the same patients. As seen in the Figure 5E and G, saliva shedding slowly and steadily decreased over the course of one year much as we have seen for mBLats after the initial rapid decay (Figure 3A). The decay in saliva shedding probably continues from the time of first arrival at the clinic but is too slow to have been detected in the short time periods studied in Figure 5D and F. A summary of all our studies is presented in box plot form in Figure 6 where we compare virus shedding by AIM patients during the acute phase of the disease (1-2 weeks after diagnosis) and in long-term convalescence (6-12 months after diagnosis). These data confirm previous findings from many groups that the median value of shedding in AIM patients falls significantly in long-term convalescence. From these studies, we conclude that levels of virus shedding simply undergo a slow and steady decline such that they have not stabilized one year later. This slow decline mirrors what is observed in mBLats (Figure 3A) after they have undergone their initial rapid exponential decay.

Comparison of virus shedding levels in the saliva of 2 groups of AIM patients: at 1 to 2 weeks (n = 8 patients) and 6 to 12 months (n = 8 patients) after diagnosis.
Comparison of virus shedding levels in the saliva of 2 groups of AIM patients: at 1 to 2 weeks (n = 8 patients) and 6 to 12 months (n = 8 patients) after diagnosis.
The half-life of CTLIEs
If our model is correct, then the observed decay of CTLIEs is dependent on 2 factors: (1) The decay is dependent on the rate at which they are produced, which is dependent on the rate at which mBLats initiate viral replication to produce the antigen that stimulates CTLIE production, which in turn is dependent on the half-life of the mBLat (HB). (2) The decay is dependent on the rate at which they disappear (ie, the intrinsic half-life of CTLs [HT]). As discussed in detail in Document, this decay can be modeled as a function of the 2 half-lives (HB and HT) as follows:
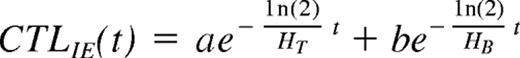
Where CTLIE (t) is the number of CTLs and a and b are constants. Because the half-life of mBLats is shorter than that of CTLs1 the contribution from the mBLat population will dominate early on but disappear and the CTLIE decay will be dominated by the half-life of the CTL (ie, the decay should be a curve as is seen in Figures 4B and 5B). As the infection resolves into long-term stable persistence, this decay dominated by HT should in turn level out. For 3 of the patients, we had time points only out to one month and the decay of CTLIEs we observed approached a simple exponential with a short half-life of 18 plus or minus 7.5 days suggesting that the decay of the mBLat population was still dominant. However, for 3 other patients, we had sufficient time points to observe the predicted curve (Document S1) and we could use the data from these to estimate the value for HT, which was 73 plus or minus 23 days (Table 4). We believe this may be the first estimate of the half-life of an antigen-specific CTL response during a persistent infection in humans.
Discussion
In this paper, we have studied the dynamics of EBV infection immediately upon diagnosis of infection (ie, patients with AIM) and as they resolve the infection into long-term persistence. Our observations are most consistent with a model whereby the ever-slower decline in overall infection, characteristic of the transition into long-term persistence, is already established by the time the patients arrive in the clinic with the exception that the level of latently infected, resting memory B cells in the peripheral blood is high but decaying exponentially. This scenario is different from those that have recently been proposed by others.14,15 We suggest that the following series of events accounts for this behavior (Figure 7). Primary infection produces transformed blasts (bBLats) that differentiate via the germinal center reaction to become latently infected resting memory B cells (mBLats) expressing no viral proteins. Over time, mBLats reactivate the virus at some frequency leading to the shedding of infectious virus and continuous cycles of new infection, latency, and reactivation. Essentially this is a one-way self-amplifying circuit (Figure 1) until the cellular immune response becomes activated. This circuit allows the virus to occupy a large portion of the memory B-cell compartment such that as many as 50% of peripheral memory B cells are latently infected with the virus.10 This process ultimately stimulates an aggressive antiviral CTL response (Figure 1) that rapidly kills mBLats as they begin replicating the virus and thereby prevents virus release, which in turn leads to a reduction in the amount of new infection of B cells. With the cessation of most if not all input from new infection, the high level of mBLats in the peripheral blood simply decays exponentially through viral reactivation.

Schematic drawing of the proposed model for the course of acute EBV infection leading to AIM. Acute EBV infection leads to ever-increasing rounds of production of mBLat reactivation and infection of new B cells resulting in high levels of mBLats and virus shedding. This stimulates strong CTL responses that drastically reduce this one-way circuit, leaving high levels of mBLats that simply decay through apoptosis according to the normal half-life of a memory B cells. Apoptosis triggers viral reactivation leading to the production of cells expressing viral IE proteins that are rapidly destroyed by CTLIEs. Hence the levels of CTLIEs fall in parallel with those of the mBLats. We hypothesize that this massive cell death causes the symptoms of AIM, leading patients to enter the clinic at a time when the levels of mBLats and CTLIEs are rapidly falling but levels of CTLs against other viral target (EA and LAT) and saliva shedding are already leveling off toward the levels found in persistent infection (dashed lines indicating the first 6 weekly visits to the clinic in our study).
Schematic drawing of the proposed model for the course of acute EBV infection leading to AIM. Acute EBV infection leads to ever-increasing rounds of production of mBLat reactivation and infection of new B cells resulting in high levels of mBLats and virus shedding. This stimulates strong CTL responses that drastically reduce this one-way circuit, leaving high levels of mBLats that simply decay through apoptosis according to the normal half-life of a memory B cells. Apoptosis triggers viral reactivation leading to the production of cells expressing viral IE proteins that are rapidly destroyed by CTLIEs. Hence the levels of CTLIEs fall in parallel with those of the mBLats. We hypothesize that this massive cell death causes the symptoms of AIM, leading patients to enter the clinic at a time when the levels of mBLats and CTLIEs are rapidly falling but levels of CTLs against other viral target (EA and LAT) and saliva shedding are already leveling off toward the levels found in persistent infection (dashed lines indicating the first 6 weekly visits to the clinic in our study).
Although we do not know what the signal is that causes the mBLats to reactivate, we assume it is not occurring in the peripheral circulation since no detectable viral replication is seen in the blood.13 We are struck however by the similarity between the half-life of mBLats (7.5 ± 3.7 days) and recent estimates of the half-life of normal memory B cells (11 ± 3.3 days).20 We have previously noted that mBLats in AIM divide at the same rate as normal memory B cells, are subject to normal memory B-cell homeostasis mechanisms,11 and do not express viral proteins.10 This suggests the possibility that the exponential decay of mBLats is simply a consequence of the normal life span of memory B cells since the mBLats are no longer being replaced at appreciable levels (ie, new infection of B cells has been minimized). In effect, mBLats are being culled by apoptosis as part of normal memory B-cell homeostasis. It has been shown in cell lines that the induction of apoptosis signals EBV to replicate.22 We speculate that culling by apoptosis is what activates mBLats to begin viral replication and expression of the immediate early (IE) antigens that stimulate the CTLIEs. Thus there is a continuous exponentially decaying supply of IE-expressing B cells to stimulate CTLIEs. This explains why the levels of CTLIEs decay in parallel with mBLats. Why do we not see a similar decay in the downstream components of the system (CTLEAs, virions, and CTLLats; Figure 2)? We suspect that once the CTL response is activated, CTLIEs rapidly kill mBLats as soon as they initiate viral replication and express IE proteins. This essentially terminates or at least minimizes the number of cells able to complete the process (ie, stimulate CTLEAs and CTLLats and produce new virions). So the level of these variables immediately drops. It is at this point that AIM patients begin to feel sick and report to the clinic (first vertical dashed line in Figure 7). There is compelling direct evidence that the peak of infection is indeed over by the time clinical symptoms arise. This is shown by data such as those in Figures 3,4A,5A. For every patient (n = 15) we have studied, the level of infected cells (mBLats) has always decreased by the second visit; an increase was never seen.
One important caveat to our studies is that we measured single epitopes for each of the 3 classes of antigens. The notion was to use the CTL response as an indicator of the status of infection not to perform a comprehensive study of the CTL response in acute infection, which has been extensively catalogued previously.16 To this end, we picked epitopes that have previously been shown to be prevalent and common during acute infection in HLA A2+ individuals.17
We conclude therefore that in AIM patients the “one-way circuit” has already been suppressed to low levels by the time they enter the clinic and it continues to trend slowly toward what is seen in long-term persistence. This notion leads to a specific prediction namely that in the tonsils from AIM patients most viral replication should already be shut down so cells replicating the virus should be rare, whereas we would expect to see copious latently infected memory B cells, mirroring the situation in the blood. This is indeed exactly what has been seen in several previous histochemical studies on such tonsils.23,24
Our observation that the level of virus shedding is relatively stable throughout the course of the disease (1-2 weeks after diagnosis) confirms similar observations recently reported by 2 other groups.14,15 However, we interpret our results differently from those authors who claimed that AIM is a state of chronic high-level shedding. In our studies, the levels of virus shedding seen in AIM underwent a slow continuous decline in virus shedding for as long as we have studied them (out to 1 year or more). This suggests that there may be a time during acute infection when there is a rapid decline in virus shedding but that this period is over by the time the patients arrive at the clinic. By this time, the levels of virus shedding are already trending toward what is seen in persistence.
The slow steady decline in virus shedding over 1 year reflects a similar process to what is seen with the numbers of infected cells in the periphery once they have finished their initial rapid decline. There are many unanswered questions that arise from these dynamics.
(1) Do the B cells that undergo rapid decay represent a different population from those that decay very slowly, that is, are there 2 sets of infected B cells, one with a short half-life of around 7 days and one with a very long half-life? Short- and long-lived reservoirs of infected cells have been shown for HIV infection, but they represent cells where the virus is either actively replicating or dormant.25 Currently, we have not been able to detect any difference between the mBLats found in acute versus long-term convalescence or persistent infection. Indeed in both populations the virus is quiescent and the cells divide at the same rate as that driven by normal memory B-cell homeostasis.13,21,26
(2) Does the level of persistent infection ever achieve true equilibrium? For both virus shedding and levels of infected cells, we have observed a slow rate of decline that becomes ever slower but has not convincingly reached stability at the longest times we have studied (more than 1 year). This trend is clear when single patients are followed.
(3) Is the “one-way circuit” shut down once the immune system is activated, that is, are the stable levels of mBLats maintained only by homeostasis mechanisms or is some level of new B-cell infection required to maintain the level of mBLats? This is a crucial question because if the later is true then it may be possible to clear or at least reduce levels of persistent infection with antiviral drugs or vaccines.
We have suggested that the apparent stability in virus shedding seen early in infection actually represents a failure to detect the slow steady decline that is revealed by observations only over longer time periods (up to 1 year). A similar concern applies to our measurements of CTLEAs where the apparent stability seen early in infection probably represents a failure to detect a slow decline that would be revealed by observations over longer time periods (up to 1 year). This is exactly what was seen in the 2 patients in whom we measured CTL responses into long-term convalescence (Document S1) and confirms previous studies.17,27
Our data show conclusively that by the time the clinical symptoms of AIM arise, the level of mBLats is always rapidly decreasing. Therefore, the emergence of clinical symptoms coincides with the massive cell death associated with the exponential decay of mBLats, not with infection per se. In this study, we have proposed that this death is associated with homeostatic culling by apoptosis, which in turn triggers entry into viral replication. It is conceivable therefore that the difference between asymptomatic primary EBV infection and AIM in adults is the extent to which the dying mBLats initiate viral replication. These ideas cast doubt on the findings of Silins et al28 who claimed that the main difference between symptomatic and asymptomatic primary EBV infection lies not in the levels of infected cells but in the extent to which T cells are mobilized and expanded. However, they measured viral loads at the peak of infection for asymptomatic patients (ie, the appearance of antiviral antibodies) but past the peak for AIM patients (ie, the time when clinical symptoms arise). Had they measured viral loads at the peak for AIM patients they would have found consistently higher viral loads than in the asymptomatic carriers.
Our studies also cast further doubt on the conclusions of Kurth et al,29 who microdissected cells from the tonsils of AIM patients and showed that the dominant population of EBV-infected cells were blasts that were not undergoing a germinal center reaction. We have pointed out previously that that these cells probably represented artifacts of acute infection30 because they have the wrong cellular and viral phenotype to be the EBV-infected germinal center cells (gcBLats; Figure 1) that we have described in healthy carriers31 and proposed as intermediaries in the production of latently infected memory B cells.1,2 Our current studies indicate that the time of massive expansion of gcBLats should already be over by the time AIM patients arrive in the clinic. The level of gcBLats is already approaching that seen in healthy carriers (ie, rare) and would not have been detected in the studies of Kurth et al. This interpretation is further supported by recent convincing evidence that expansion of EBV-infected cells expressing the gcBLat phenotype does occur in GCs very early when RAG−/−Cg−/− mice, reconstituted with a human immune system, are infected with EBV (Cocco et al, manuscript submitted).
EBV infection and AIM in particular are risk factors for several important diseases, including Hodgkin disease8 and multiple sclerosis.5 It has also been suggested that AIM permanently impacts the immune system.4 We have proposed that AIM symptoms are coincidental with the rapid destruction by CTLIEs of mBLats as they enter into viral replication. Since up to 50% of mBLats are latently infected at the peak of infection and their half-life is approximately 7 days, this implies that 50% of mBLats, constituting 25% of the entire memory B-cell compartment, may be destroyed in 1 week at the height of the infection. This constitutes a massive, continuous deposition of cellular and viral antigens into the system. This action could be what is responsible for the long-term damage inflicted on the immune system and the predisposing factor for the AIM-associated diseases.
We conclude that by the time AIM patients arrive at the clinic the immune response has already minimized the cycles of reactivation and infection of new B cells, leaving the high levels of mBLats in the blood to simply decay through reactivation of viral lytic replication until a low-level equilibrium is attained. This culling process may be initiated by the same processes that regulate the normal half-life of memory B cells.
The online version of this article contains a data supplement.
The publication costs of this article were defrayed in part by page charge payment. Therefore, and solely to indicate this fact, this article is hereby marked “advertisement” in accordance with 18 USC section 1734.
Acknowledgments
We thank Allen Parmelee and Steve Kwok for fluorescence-activated cell sorting, Robin Brody for preparing patient samples, and Rosemary Ciccarelli at University Health Services, University of Massachusetts, Amherst for patient recruitment.
This work was supported by Public Health Research Grants CA65883, AI18757, AI062989 (D.A.T.-L.), and AI49320 (K.L.).
Authorship
Contribution: V.H. performed and designed research and wrote the paper; M.S. analyzed data; T.C.G. performed research; J.L.S. and K.L. contributed clinical samples; and D.A.T.-L. designed research and wrote the paper.
Conflict-of-interest disclosure: The authors declare no competing financial interests.
Correspondence: David A. Thorley-Lawson, Dept of Pathology, Jaharis Building, Tufts University School of Medicine, 150 Harrison Ave, Boston MA 02111; e-mail: david.thorley-lawson@tufts.edu.

This feature is available to Subscribers Only
Sign In or Create an Account Close Modal