Abstract
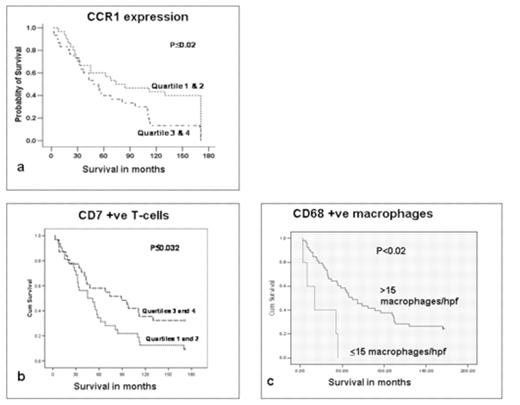
Gene expression profiling studies have demonstrated immune response gene signatures predictive of outcome in follicular lymphoma (FL) and there is a need for validation of these signatures and for their translation to clinical use. However, measurement of these genes in routine practice remains difficult and to date there have been very few studies validating the hypothesis. We have previously demonstrated the utility of real-time PCR measurement of gene expression levels in globally amplified polyA cDNA as a clinically practical method for translation of gene signatures to clinical use. In this project we extended the method to analysis of immune response signatures in FL. We used real-time PCR to measure expression levels (normalised to the mean of 4 housekeeping genes) of 36 candidate Indicator genes, selected from microarray studies, in polyA cDNAs prepared using polyA PCR (method detailed in Sakhinia et al 2007) from 58 archived human frozen lymph nodes, together with immunohistochemistry for CD3, CD4, CD7, CD8, CD10, CD20, CD21 and CD68 in parallel formalin fixed paraffin embedded tissue samples to measure immune response in FL. Immunohistochemical positivity was measured by a semi-automated image analysis method using spectral unmixing to identify areas of immunopositivity. Kaplan-Mier survival analysis was performed against the normalised real-time PCR expression levels of each of the genes and against the percentage immunohistochemical postivity for CD3, CD4, CD7, CD8, CD10, CD20, CD21; for CD68 survival analysis was performed for cases with either 15 or less or more than 15 CD68 positive cells per high power field (hpf). High levels of CCR1, a marker of monocyte actication, were associated with a shorter survival interval (p<0.02) (figure 1a), whilst immunohistochemistry demonstrated association of high numbers of CD7 positive T-cells with longer survival interval (figure 1b) (p<0.032) and of high numbers of CD68 positive macrophages with a shorter survival interval (figure 1c) (p<0.02). The results confirm the role of the host immune response in outcome in FL and identify CCR1 as a prognostic indicator and marker of immune switch between macrophage and T-cell dominant response. The methods used are clinically applicable, whilst the clinical utility of polyA DNA and real-time PCR for measurement of gene signatures and the strength of this approach as a “molecular block” are confirmed.
Kaplan-Meier Survival Plots for upper (3&4) and lower (1&2) quartiles of a) CCR1 expression and b) number of CD7 +ve cells, and c) cases with less then vs greater than or equal to 15 macrophages per high power field CCR1 measured by real-time PCR and CD7 and macrophage numbers by immunohistochemistry and image analysis
Kaplan-Meier Survival Plots for upper (3&4) and lower (1&2) quartiles of a) CCR1 expression and b) number of CD7 +ve cells, and c) cases with less then vs greater than or equal to 15 macrophages per high power field CCR1 measured by real-time PCR and CD7 and macrophage numbers by immunohistochemistry and image analysis
Reference:
Author notes
Disclosure: No relevant conflicts of interest to declare.


This feature is available to Subscribers Only
Sign In or Create an Account Close Modal