Abstract
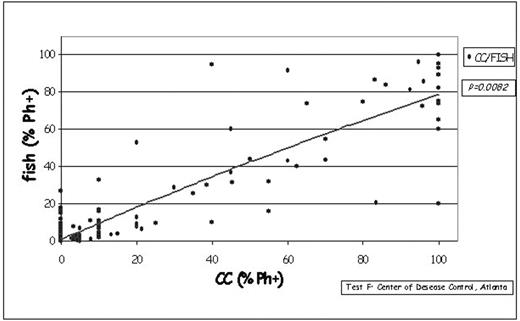
We planned a prospective analysis involving 3 multicentric national studies of the GIMEMA (Gruppo Italiano Malattie Ematologiche Adulto) CML Working Party (WP) to evaluate the correlation between conventional cytogenetics (CC) and FISH response in CML pts in chronic phase (CP) treated with Imatinib. Karyotype and FISH analyses were performed on bone marrow (BM) cells in 26 local laboratories and in 12 WP reference labs. Peripheral blood samples for quantitative RT-PCR were centralized in Bologna. The data are reported in Figure 1 and in Table 1. Fig 1 shows the relationship between CC and FISH (r=0.91;p=0.008). Tab 1 shows the demonstration of FISH data according to CC data and the number of metaphases available for CC. Of 217 pts in CCgR by CC and > 20 metaphases studied, 81.6% were FISH negative, 15.2% showed a low rate of FISH positive cells (1–5%) and 3.2% an higher rate. Of 94 pts in CCgR by CC but with < 20 metaphases studied, 71.3% were FISH negative, 21.3% showed a low rate of FISH positive cells (1–5%) and 7.4% an higher rate. Of 43 pts in PCgR by CC and FISH positive, 48.8% showed 1– 5% positive cells. Moreover, 358 samples were performed simultaneously by CC, FISH and quantitative RT-PCR: 179 (50%) samples in CCgR showed major molecular response (MMolR, defined as a BCR-ABL × 100 ratio < 0.1%): 164 (91.6%) were FISH negative and 15 (8.4%) were FISH positive (1.3–10% positive cells). We conclude that interphase FISH is a very releable method of monitoring the CCgR once it has been achieved. The relationship of FISH on BM cells with molecular response is at least as good as the relationship of CC with molecular response. It remains to be shown if the same results can be obtained on peripheral blood cells, that are already widely used for molecular monitoring.
| . | No . | FISH negative . | FISH 1–5% . | FISH > 5% . |
|---|---|---|---|---|
| CCgR ≥ 20 met | 217 | 177 (81.6%) | 33 (15.2%) | 7 (3.2%) |
| CCgR < 20 met | 94 | 67 (71.3%) | 20 (21.3%) | 7 (7.4%) |
| PCgR ≥ 20 met | 43 | 0 | 21 (48.8%) | 22 (51.2%) |
| CCgR and MMolR | 179 | 164 (91.6%) | 12 (6.7%) | 3 (1.7%) |
Figure
Supported by: COFIN2005, RFO2005, AIRC, CNR, European LeukemiaNet, AIL.
Disclosure: No relevant conflicts of interest to declare.
Author notes
Corresponding author


This feature is available to Subscribers Only
Sign In or Create an Account Close Modal