Abstract
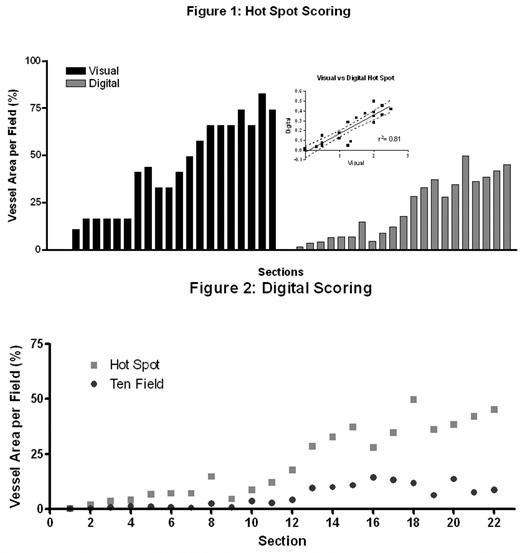
Hemophilia is a genetic disorder caused by a deficiency of blood coagulation factor VIII or IX. The most serious symptom is bleeding into joints, which over time leads to a proliferative, inflammatory disorder known as hemophilic synovitis. In time, the synovitis develops into hemophilic arthropathy, a form of incapacitating arthritis. While this sequence of events is well documented, the components responsible for the development of hemophilic synovitis are largely unknown. Recent evidence suggests that there is a relation between synovitis and vessel formation. Investigation of this cause-and-effect relationship necessitates a quantitative means of analyzing synovial and vessel hyperplasia. The goal of this experiment is to determine the utility of digital analysis of vessel formation by comparison to visual “hot-spot” scoring (Valentino and Hakobyan 2006, in press). Digital scores were expressed as percentages by dividing the number of vessel pixels in the densest area (“hot-spot”) by the total pixels in the field or separating the entire joint into 10 regions then averaging the percentages from each (“ten field”). Twenty-two histological sections from mouse joints with hemophilic synovitis were scored by visual and digital methods (Fig 1). The correlation of the two “hot-spot” methods (visual and digital) was good (r2=0.81). Next, the relationship of digital “hot-spot” and “ten field” analysis is shown in Fig.2. These data support the use of digital image analysis for evaluation of vessel formation and will allow for rapid examination of multiple samples.
Disclosure: No relevant conflicts of interest to declare.
Author notes
Corresponding author


This feature is available to Subscribers Only
Sign In or Create an Account Close Modal