Abstract
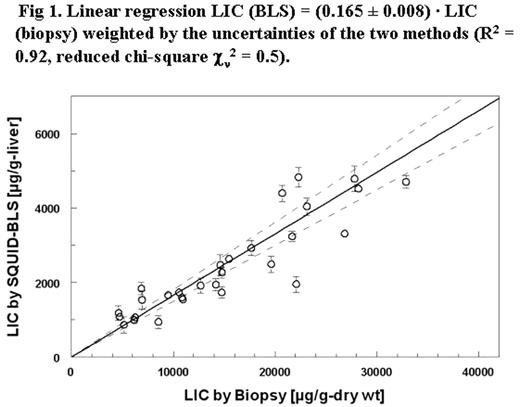
Liver biopsy, which is the gold standard for liver iron assessment in patients with hemosiderosis, is painful, associated with risk of infection or bleeding, and may be affected by uneven iron distribution and variation in analytical methods. Monitoring iron overload by serum ferritin is still a routine practice although its limitations are well known. Therefore, using non-invasive liver iron assessment by quantitative MRI or by liver susceptometry with a SQUID biomagnetometer (BLS) would be the better alternatives. This report explores the accuracy of liver iron concentration (LIC) measured by BLS at CHRCO compared to liver biopsy, in patients with thalassemia and sickle cell disease. A total of 33 patients with chronically transfused thalassemia (n=16) or sickle cell disease (n= 17) were prospectively assessed for LIC measured by BLS and liver biopsy within 2 month of each other. LIC was measured by a low temperature SQUID biosusceptometer system (Ferritometer®) under the standardized Hamburg-Torino-Oakland protocol. Iron in fresh tissue liver biopsy samples (with a dry weight larger than 1 mg) was measured at Mayo clinics by Inductively Coupled Plasma Mass Spectrometer (ICP-MS). Median value for the wet to dry weight of the tissue samples was 3.8 (3.1–6.2). Subjects ranged in age from 7 to 40 years (median: 18 y). Median LIC (wet weight) measured by SQUID was 1915 (415–4826) [mg/g wet weight ], median LIC by biopsy (dry weight) was 12681(1854–32864) [mg/g dry weight]. Serum ferritin ranged from 405 to 9843 (median: 1831). The Spearman rank correlation between wet weight LIC assessed by BLS and dry weight LIC from fresh tissue sample measured by ICP-MS was highly significant (RS=0.93, p<0.0001). The conversion factor between the two methods obtained from a weighted linear regression with zero intercept was 6.1 ± 0.3 (R2 = 0.92, cn2 = 0.5), while the median value for wet-to-dry weight ratio of the actual samples is 3.8. This conversion factor agrees with the value reported earlier by Piga et al (
LInear regression LIC (BLS)=(0.165 ± 0.008) *LIC (biopsy) weighted by the uncertainties to the two methods (R2 = 0.92, reduced chi-square χ2= 0.5).
LInear regression LIC (BLS)=(0.165 ± 0.008) *LIC (biopsy) weighted by the uncertainties to the two methods (R2 = 0.92, reduced chi-square χ2= 0.5).
Disclosures: Dr.Bob Fagaly is vice president of Tristan Technology which is the manufacturer of the SQUID machine.; Dr. Bob Fagaly.
Author notes
Corresponding author


This feature is available to Subscribers Only
Sign In or Create an Account Close Modal